
THETAUSD
Every week Tech Charts Global Equity Markets report features some of the well-defined, mature classical chart patterns under a lengthy watchlist and the chart pattern breakout signals that took place during that week. Global Equity Markets report covers single stocks from developed, emerging and frontier markets, ETF’s, select commodities, cryptocurrencies and global equity indices.
Tech Charts membership started including a new addition to our research offering, the special cryptocurrency report where I continue to find classical chart pattern opportunities on different cryptocurrency pairs. Below is a chart on THETAUSD from the latest special cryptocurrency report.
THETAUSD
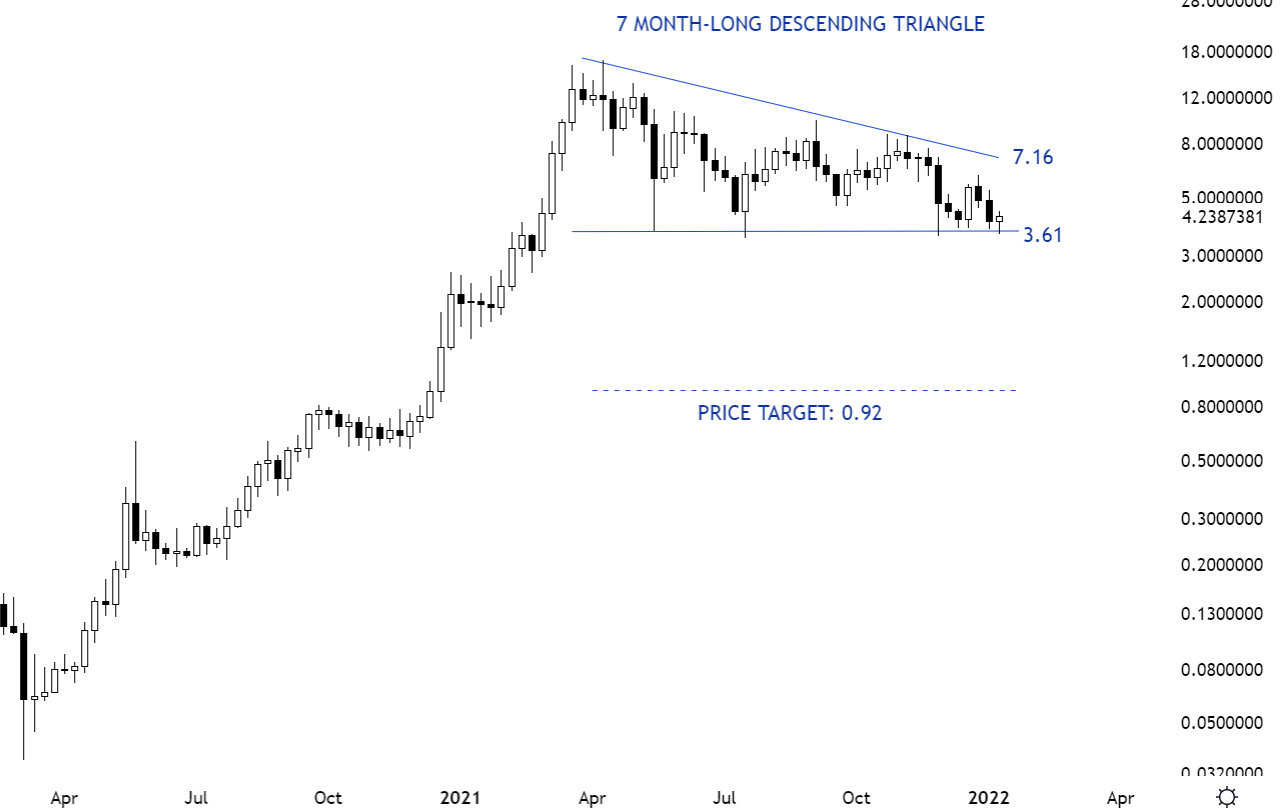
Descending triangle is a bearish chart pattern. Its downward sloping upper boundary gives the pattern the bearish bias. It shows sellers impatience to sell at lower levels every time price rebounds from the horizontal support. Breakdown below the horizontal support after several tests can complete the chart pattern.
THETAUSD is another pair that has possibly formed a descending triangle chart pattern. The lower boundary is well defined with several tests. The upper boundary is clearly downward sloping showing lower highs. Breakdown below 3.61 levels can target 0.92 levels. This is another pair I will play the short side if cryptocurrencies in general come under selling pressure.
Tech Charts Membership

By becoming a Premium Member, you’ll be able to improve your knowledge of the principles of classical charting.
With this knowledge, you can merge them with your investing system. In fact, some investors use my analyses to modify their existing style to invest more efficiently and successfully.

As a Premium Member of Aksel Kibar’s Tech Charts,
You will receive:
-
Global Equities Report. Delivered weekly.
-
Classical charting principles. Learn patterns and setups.
-
Actionable information. Worldwide indices and stocks of interest.
-
Risk management advice. The important trading points of each chart.
-
Information on breakout opportunities. Identify the ones you want to take action on.
-
Video tutorials. How patterns form and why they succeed or fail.
-
Watch list alerts. As they become available so you can act quickly.
-
Breakout alerts. Usually once a week.
-
Access to everything (now and as it becomes available)o Reports
o Videos and video series -
Multi-part webinar course. You learn the 8 most common charting principles.
-
Webinars. Actionable and timely advice on breaking out chart patterns.
For your convenience your membership auto renews each year.


