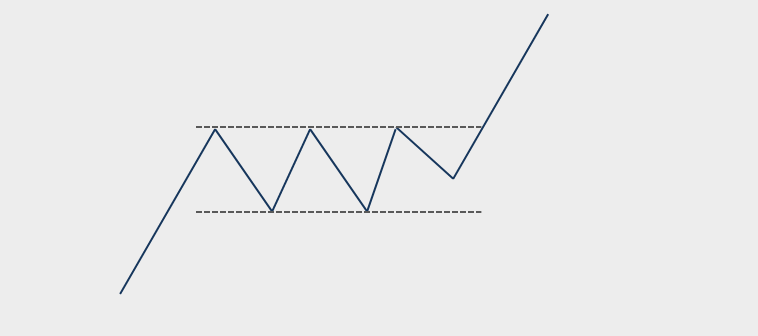
RECTANGLE BREAKOUT OPPORTUNITY
Every week Tech Charts Global Equity Markets report features some of the well-defined, mature classical chart patterns under a lengthy watchlist and the chart pattern breakout signals that took place during that week. Global Equity Markets report covers single stocks from developed, emerging and frontier markets, ETF’s and global equity indices. The report starts with a review section that highlights the important chart developments on global equity benchmarks. This blog post features from the watchlist section a rectangle chart pattern that is listed on the Milan Stock Exchange.
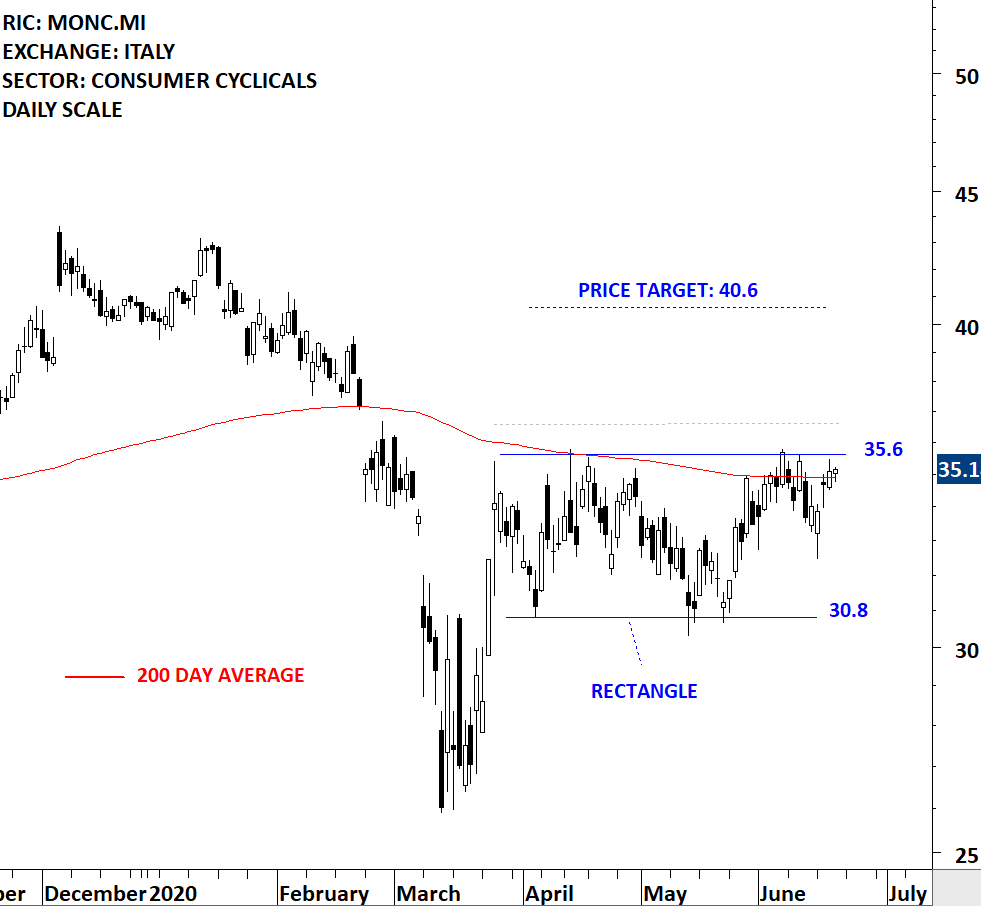
MONCLER SPA (MONC.MI)
Moncler SpA is an Italy-based company engaged in fashion industry. The Company designs, produces and distributes clothing and accessories through Moncler brand. The stock is listed on the Milan Stock Exchange. Over the past 3 months the stock formed a short-term consolidation between 30.8 and 35.6 levels. The short-term consolidation can be identified as rectangle. A daily close above 36.6 levels will confirm the breakout with the possible chart pattern price target of 40.6 levels. Breakout from the rectangle can also clear the 200-day average which is acting as resistance at the same level. I’ve adjusted the upper boundary of the rectangle to 35.6 levels to better reflect the boundaries of the consolidation range. (Data as of June 18, 2020 CET 10:30 AM) (Learn more: Video Tutorial)
Tech Charts Membership

By becoming a Premium Member, you’ll be able to improve your knowledge of the principles of classical charting.
With this knowledge, you can merge them with your investing system. In fact, some investors use my analyses to modify their existing style to invest more efficiently and successfully.

As a Premium Member of Aksel Kibar’s Tech Charts,
You will receive:
-
Global Equities Report. Delivered weekly.
-
Classical charting principles. Learn patterns and setups.
-
Actionable information. Worldwide indices and stocks of interest.
-
Risk management advice. The important trading points of each chart.
-
Information on breakout opportunities. Identify the ones you want to take action on.
-
Video tutorials. How patterns form and why they succeed or fail.
-
Watch list alerts. As they become available so you can act quickly.
-
Breakout alerts. Usually once a week.
-
Access to everything (now and as it becomes available)o Reports
o Videos and video series -
Multi-part webinar course. You learn the 8 most common charting principles.
-
Webinars. Actionable and timely advice on breaking out chart patterns.
For your convenience your membership auto renews each year.


