
RECTANGLE BULLISH CONTINUATION
Every week Tech Charts Global Equity Markets report features some of the well-defined, mature classical chart patterns under a lengthy watchlist and the chart pattern breakout signals that took place during that week. Global Equity Markets report covers single stocks from developed, emerging and frontier markets, ETF’s and global equity indices. The report starts with a review section that highlights the important chart developments on global equity benchmarks. This blog post features from the watchlist section a rectangle chart pattern that is listed on the Hong Kong Stock Exchange.
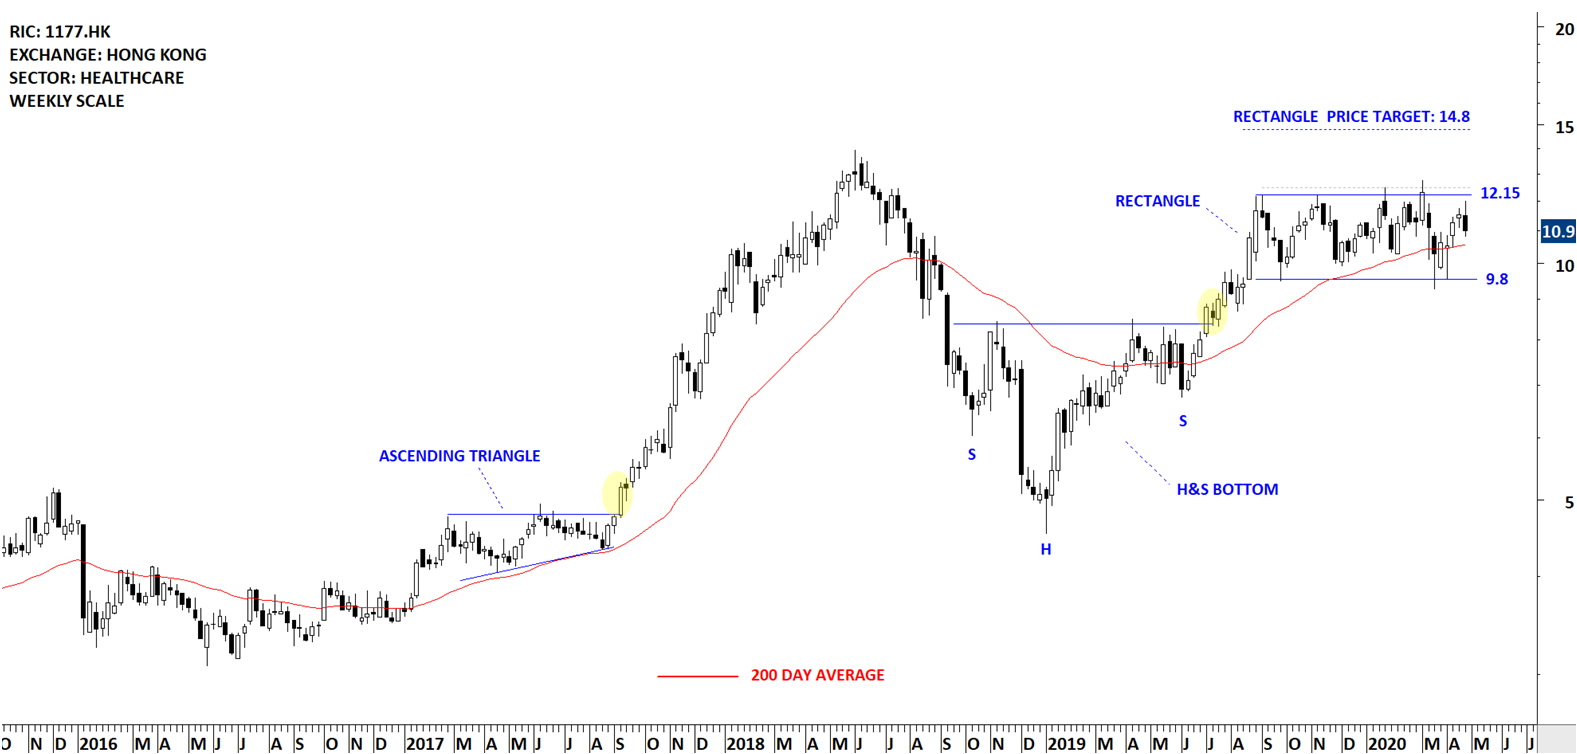
SINO BIOPHARMACEUTICAL LTD (1177.HK)
Sino Biopharmaceutical Limited is an investment holding company principally engaged in the medicine products business. The stock is listed on the Hong Kong Stock Exchange. Price chart formed a 6 month-long rectangle with the horizontal boundary acting as strong resistance at 12.15 levels. The horizontal boundary was tested several times over the course of the chart pattern. A daily close above 12.5 levels will confirm the breakout from the 6 month-long rectangle with the possible chart pattern price target at 14.8 levels. Please note that this is a weekly scale price chart and the last weekly candle includes two days of trading. (Data as of April 21, 2020)
The chart below highlights previous well-defined chart patterns and the breakout signals. It is a good case study to go through what I usually look for on price charts.
- A bullish chart pattern should complete above the 200-day moving average. Likewise a bearish chart pattern should complete below the 200-day moving average. I use 200-day average as a trend filter.
- Preferably a well-defined chart pattern should have horizontal boundary and the breakout should take place through the horizontal boundary.
- Before the breakout takes place, the horizontal boundary should be tested several times. Several tests of chart pattern boundary suggests that the technical level is recognized by market participants.
- Breakout should be taking place from a low volatility condition. Volatility is cyclical. Low volatility is followed by high volatility and vice versa. A low volatility condition presents itself in one of the well-defined classical chart patterns.
Tech Charts Membership

By becoming a Premium Member, you’ll be able to improve your knowledge of the principles of classical charting.
With this knowledge, you can merge them with your investing system. In fact, some investors use my analyses to modify their existing style to invest more efficiently and successfully.

As a Premium Member of Aksel Kibar’s Tech Charts,
You will receive:
-
Global Equities Report. Delivered weekly.
-
Classical charting principles. Learn patterns and setups.
-
Actionable information. Worldwide indices and stocks of interest.
-
Risk management advice. The important trading points of each chart.
-
Information on breakout opportunities. Identify the ones you want to take action on.
-
Video tutorials. How patterns form and why they succeed or fail.
-
Watch list alerts. As they become available so you can act quickly.
-
Breakout alerts. Usually once a week.
-
Access to everything (now and as it becomes available)o Reports
o Videos and video series -
Multi-part webinar course. You learn the 8 most common charting principles.
-
Webinars. Actionable and timely advice on breaking out chart patterns.
For your convenience your membership auto renews each year.


