GLOBAL EQUITY MARKETS – January 11, 2020
REVIEW
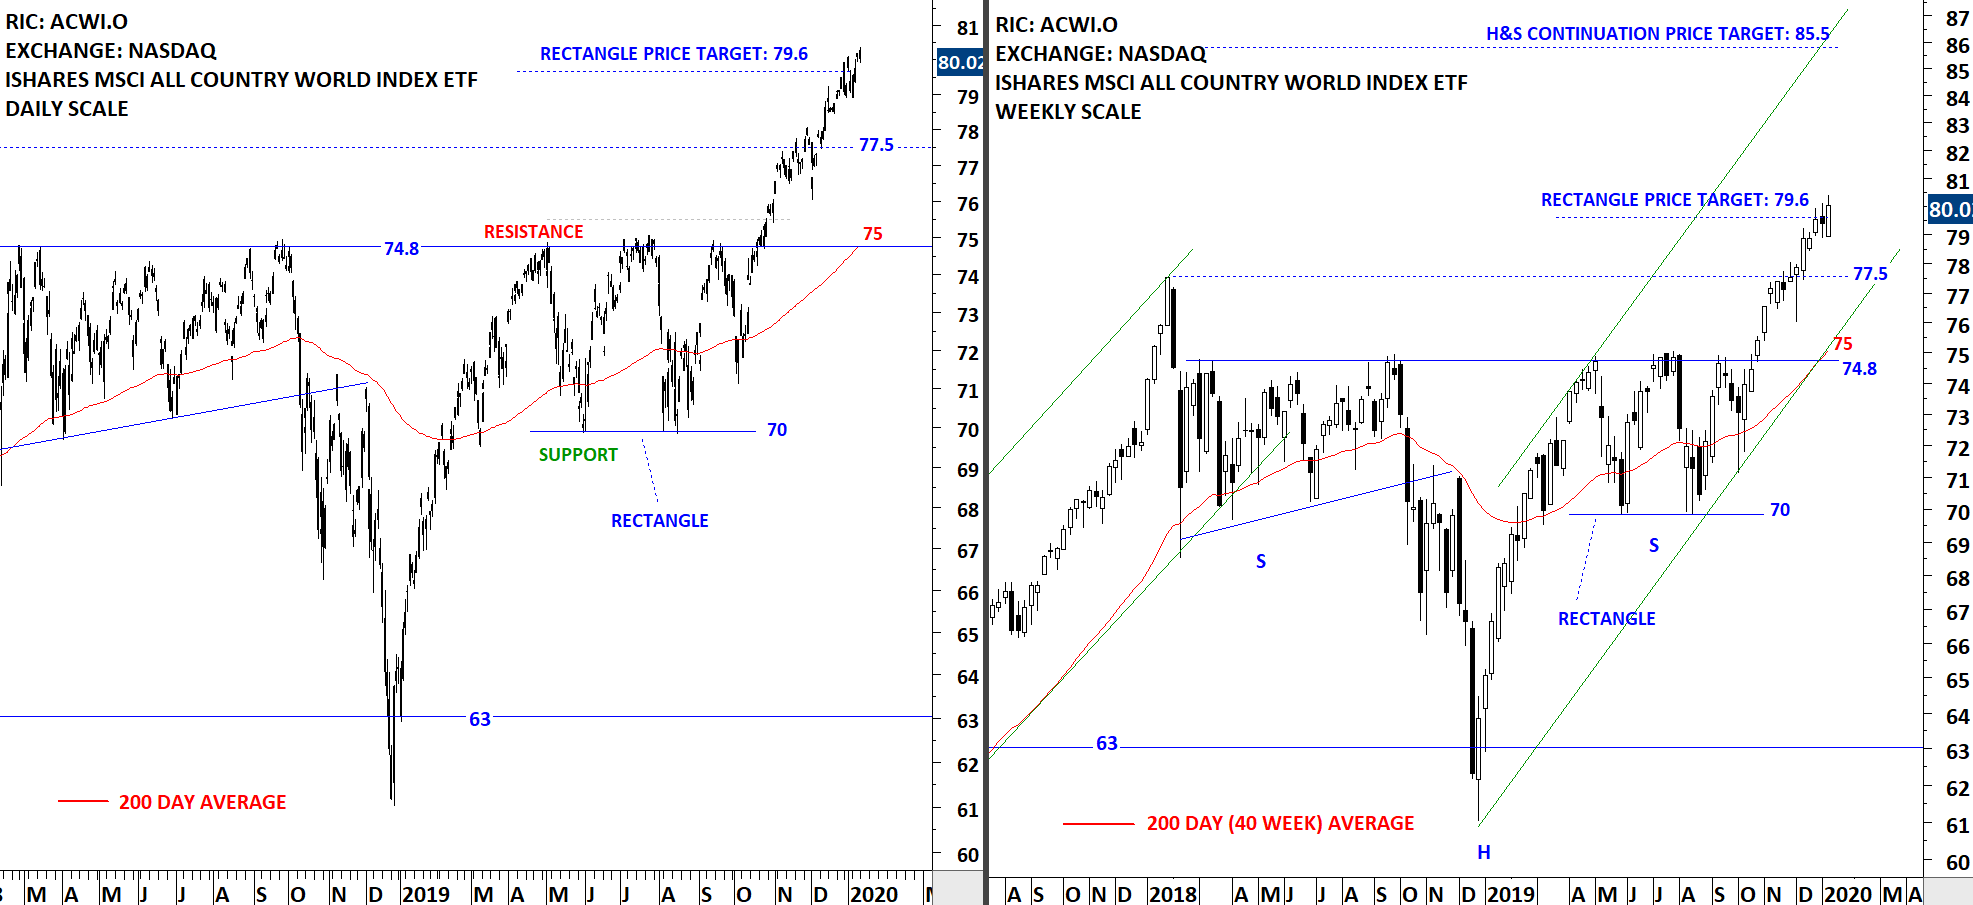
The benchmark for the Global equity markets performance, the iShares MSCI All Country World Index ETF (ACWI.O) continues to remain strong after completing both rectangle and H&S continuation chart patterns. The right shoulder of a possible H&S continuation was identified as a rectangle with the price target of 79.6 levels. So far the price remained stable after reaching price objective. ACWI ETF is in a steady uptrend. During any pullback, the high of 2018 (77.5) can act as support.
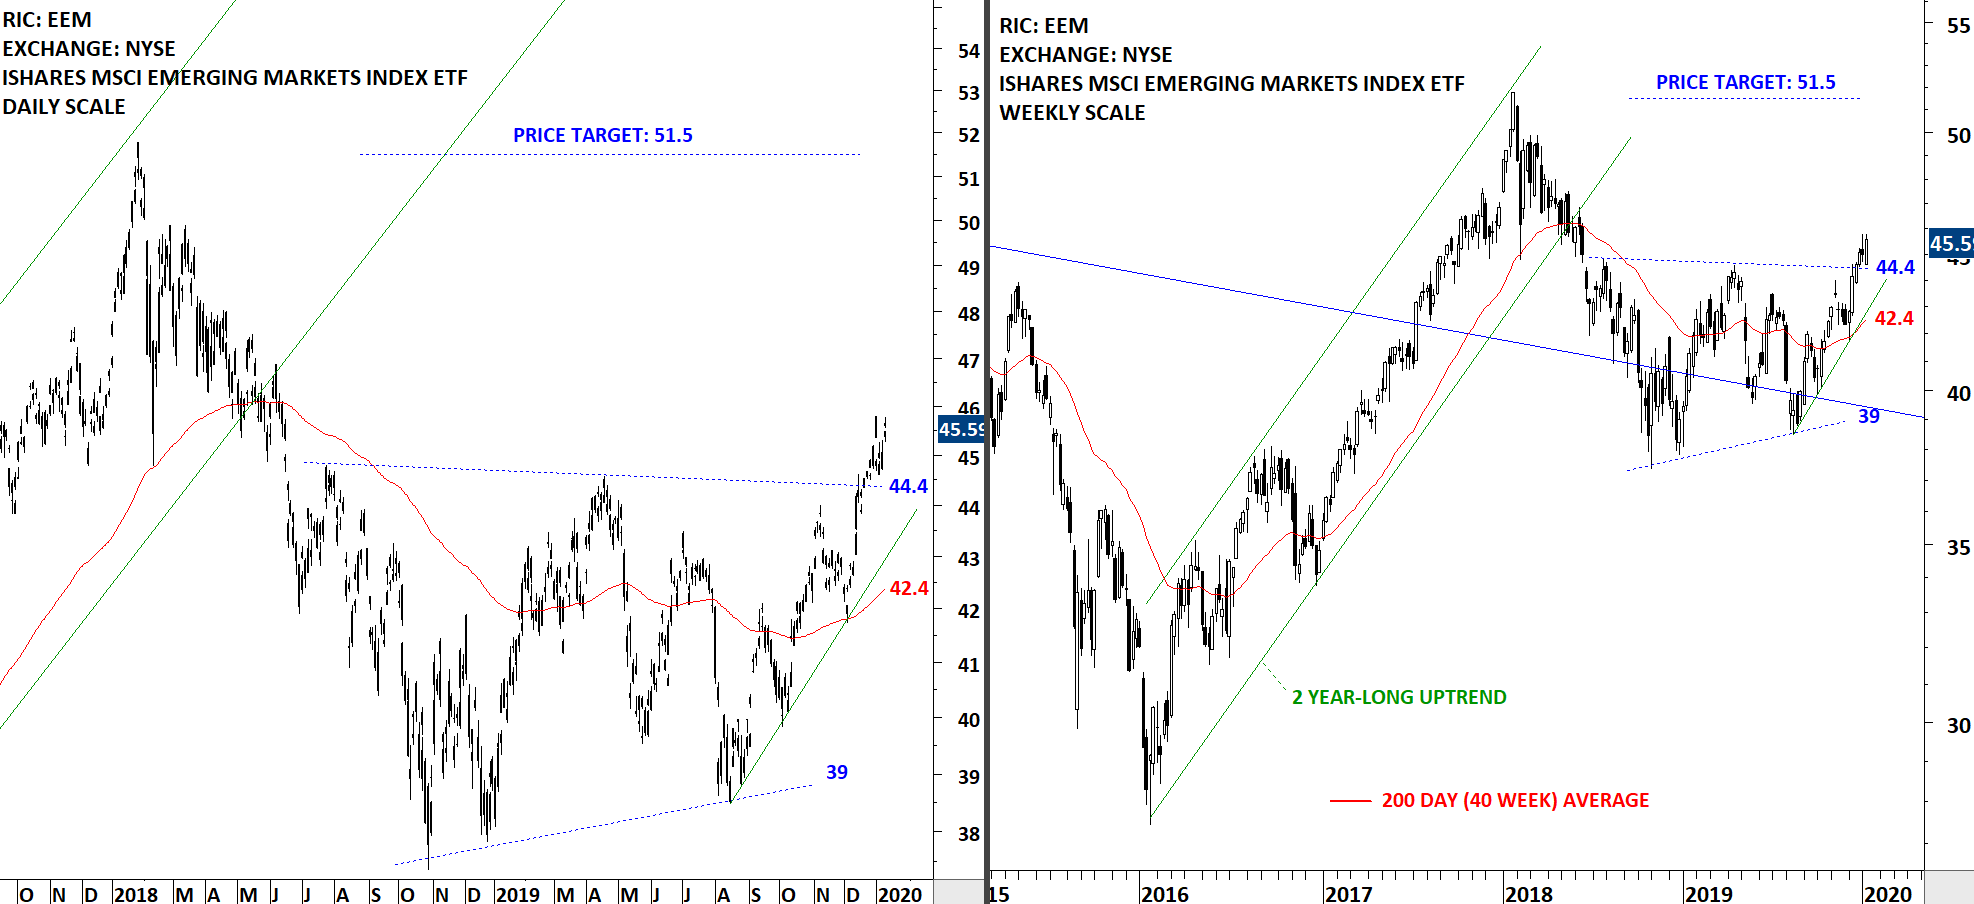
The benchmark for the Emerging Markets performance, the iShares MSCI Emerging Markets Index ETF (EEM) cleared the upper boundary of its year-long sideways consolidation at 44.4 levels. This week’s price action was strong and the ETF held above the upper boundary of its consolidation at 44.4 levels. The consolidation on EEM can act as a bottom reversal (double bottom) or (symmetrical triangle reversal). Possible chart pattern price target for EEM stands at 51.5 levels. Support remains at 44.4 levels.
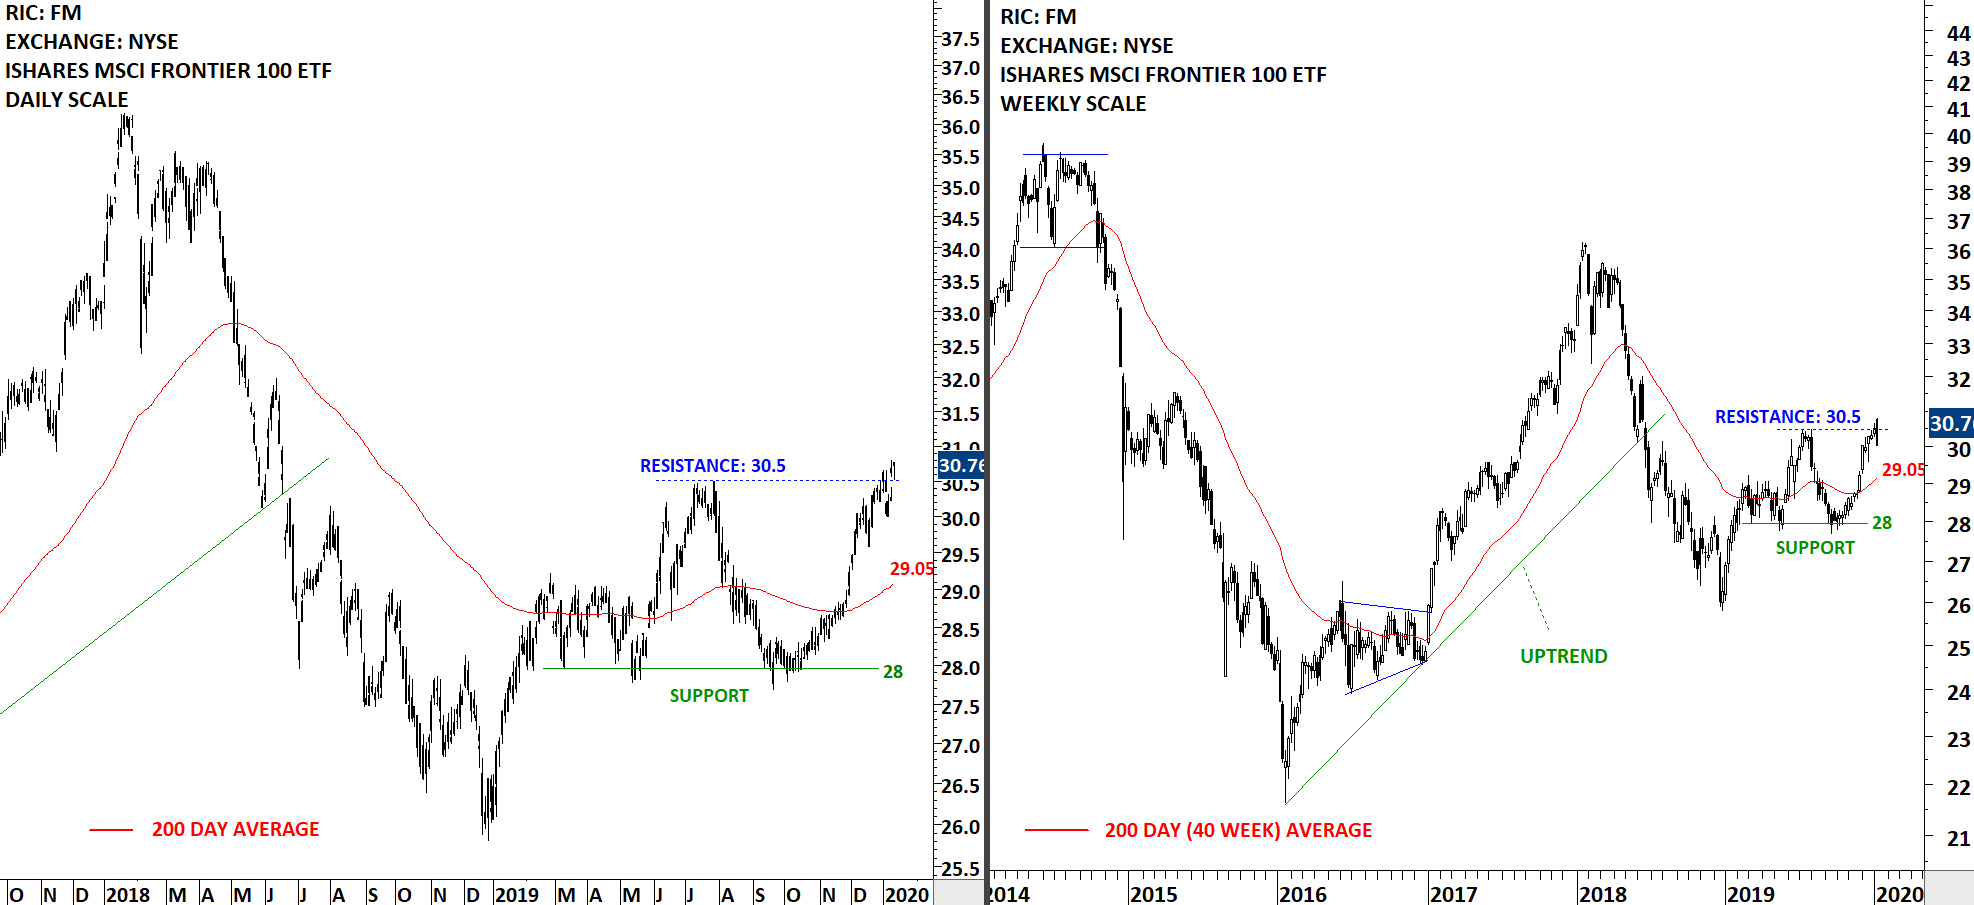
The benchmark for the Frontier equity markets performance, the iShares MSCI Frontier 100 ETF, closed the week above the resistance at 30.5 levels. The ETF is above its 200-day average. Support remains at 29.05 levels. It is still early to call this week’s price action a breakout above the resistance at 30.5 levels. I will monitor this chart for daily bullish continuation chart patterns around the resistance at 30.5.
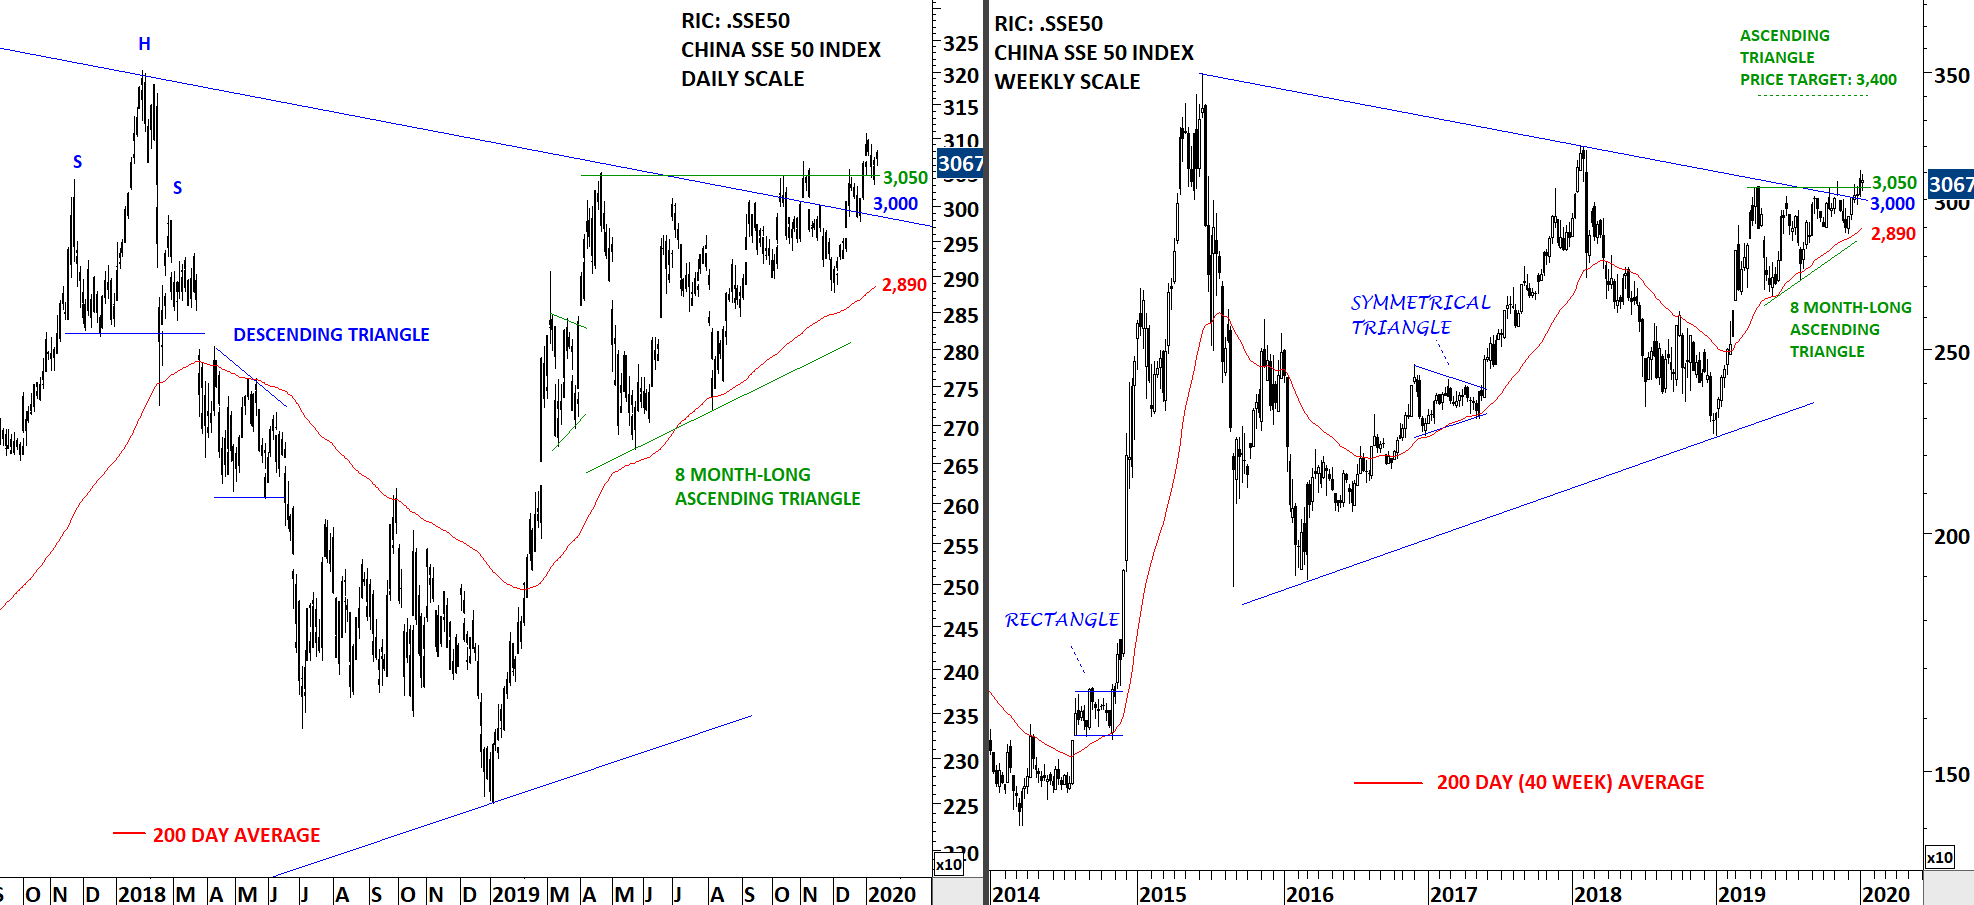
China SSE 50 Index cleared the resistance between 3,000-3,050 levels. Breakout can start a new strong uptrend. If the developing chart pattern since the first quarter of 2019 is an ascending triangle, the initial price objective will be at 3,400 levels. 3,000-3,050 area will act as support. The index needs to move away from the chart pattern boundary at 3,050 levels. A breakout needs momentum. Hesitation around chart pattern boundary can signal further indecision and morphing of the pattern. I will monitor this chart for strength in the coming weeks.
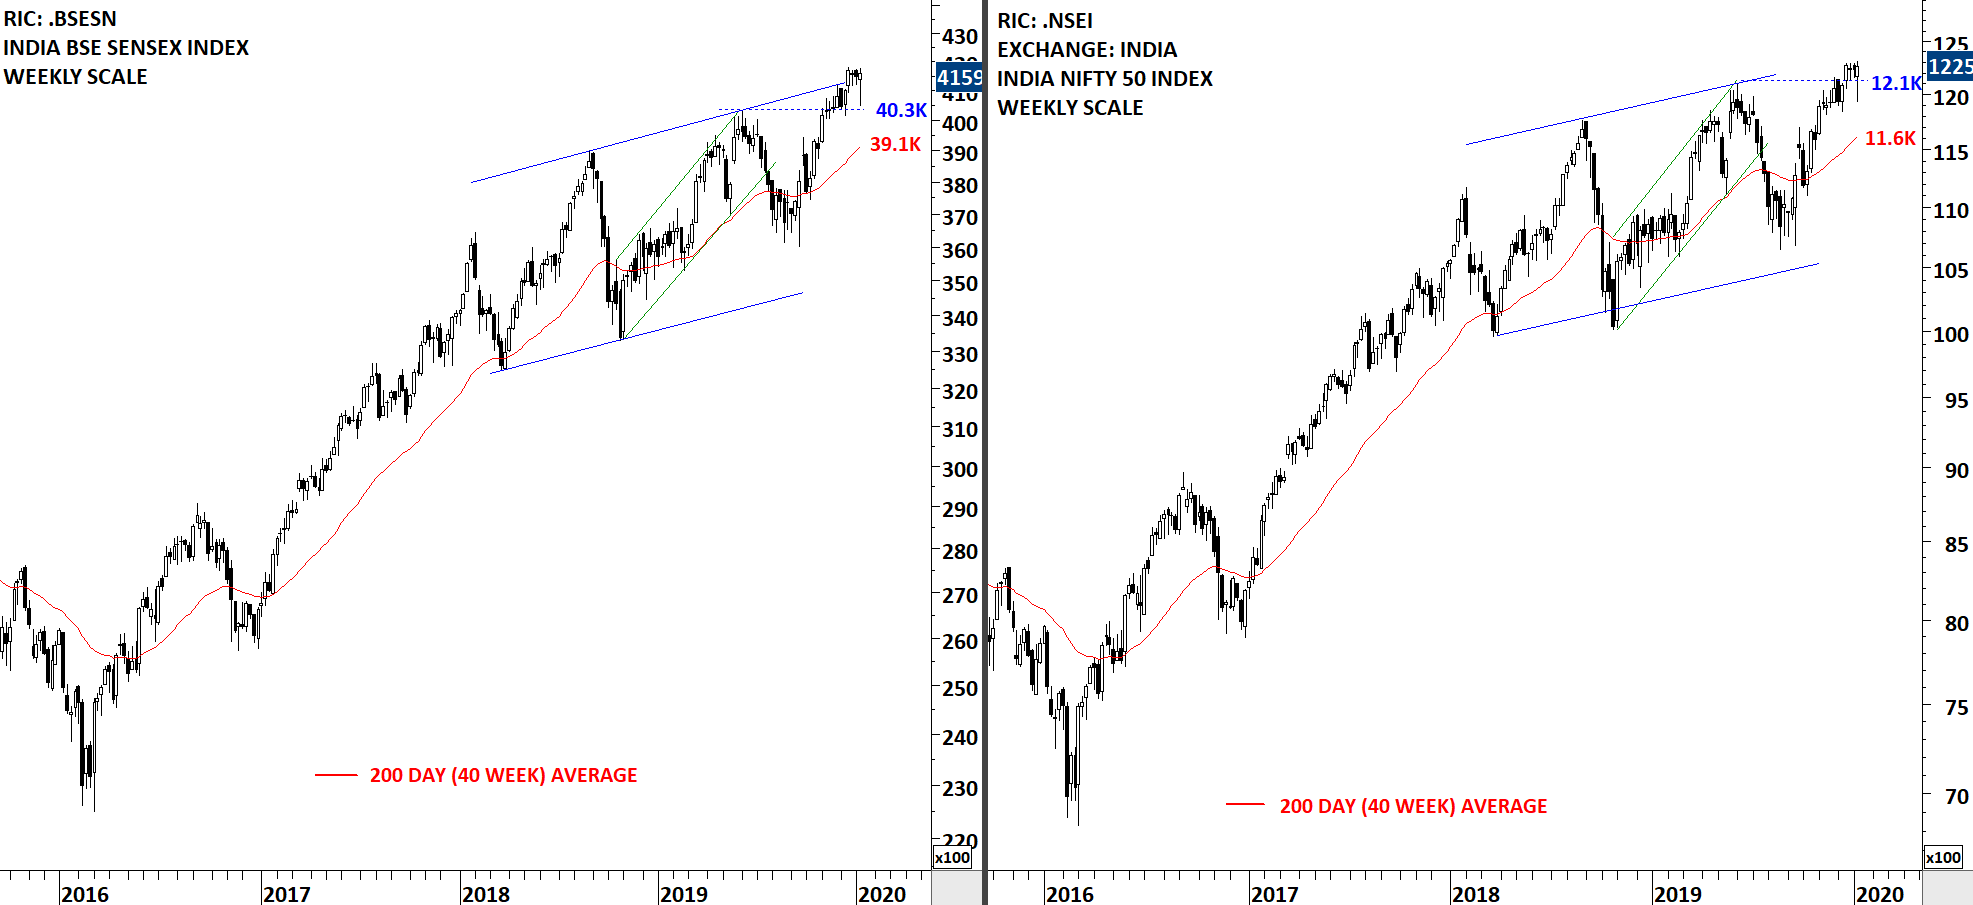
Both BSE Sensex and Nifty 50 Indices pulled back to their respective supports at 40.3K and 12.1K. The week finished strong at the highest level of the weekly candles. Both charts are showing a steady uptrend.
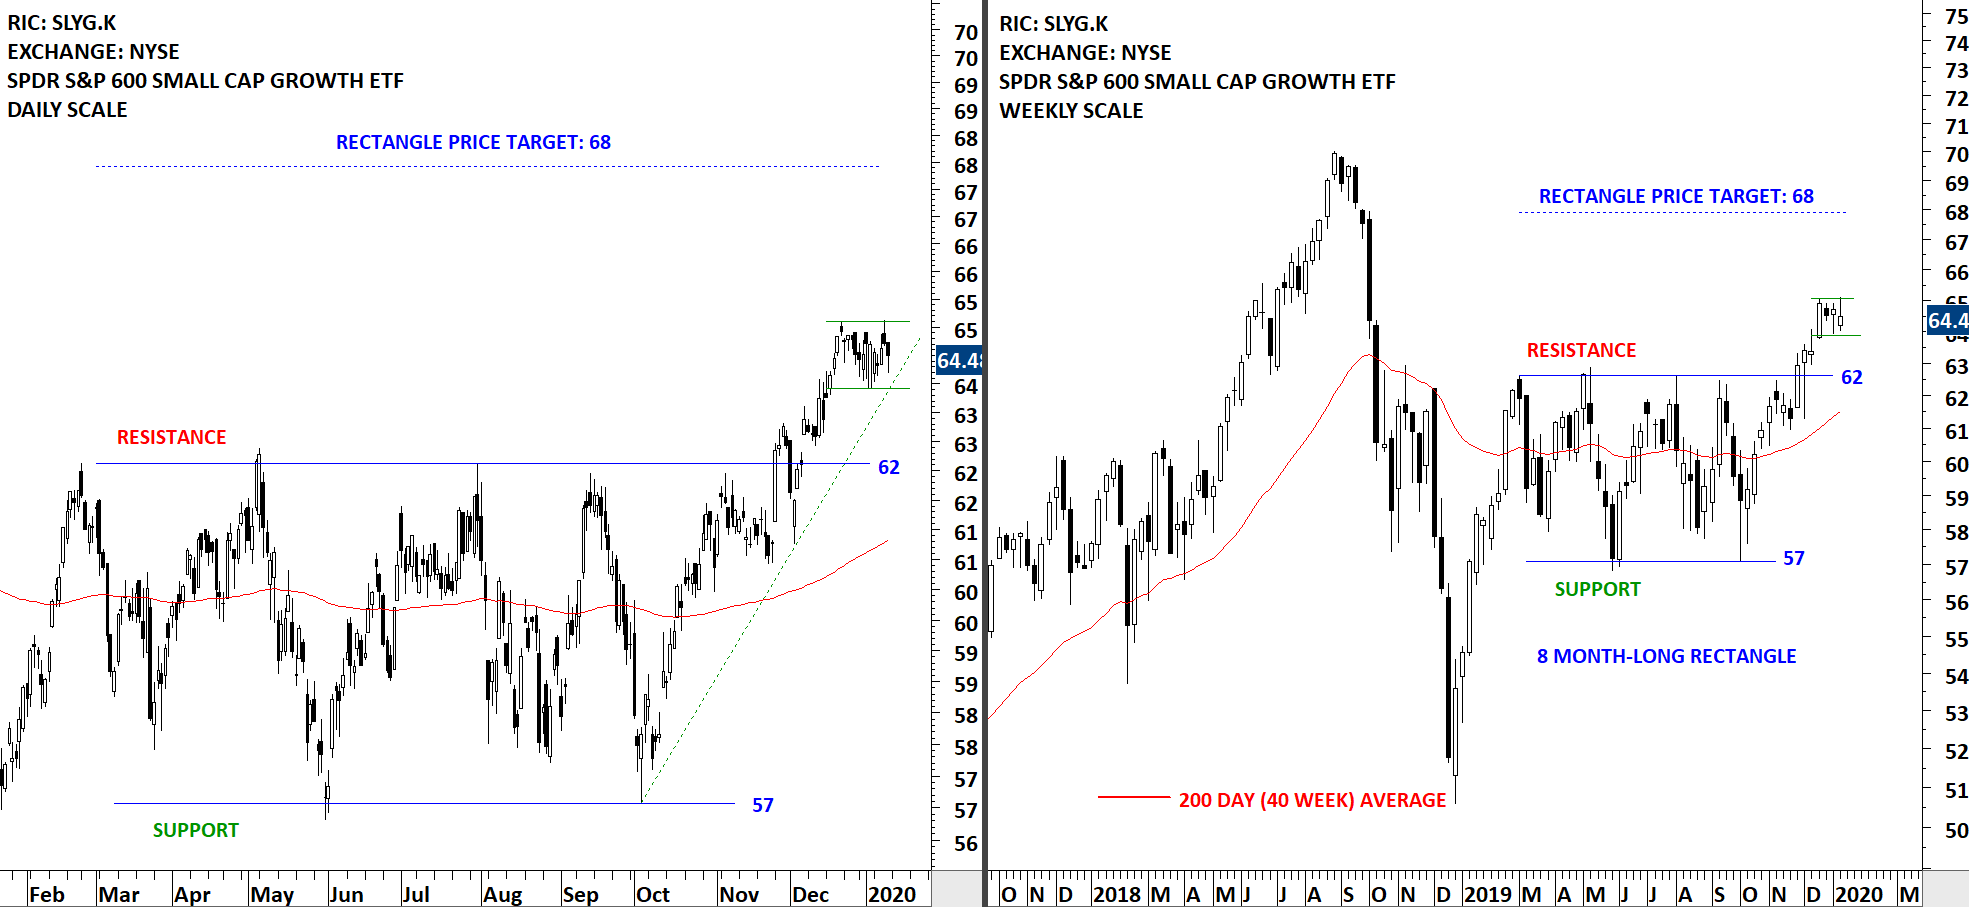
The daily close above 63.8 levels for SPDR S&P 600 Small Cap Growth ETF (SLYG.K) confirmed the breakout from the 8 month-long rectangle. Breakouts after several tests of chart pattern boundary usually result in strong trend periods. Possible price target for SLYG stands at 68 levels. SLYG is possibly forming a short-term consolidation that can be identified as a bullish flag. Breakout from the short-term consolidation can resume the uptrend.
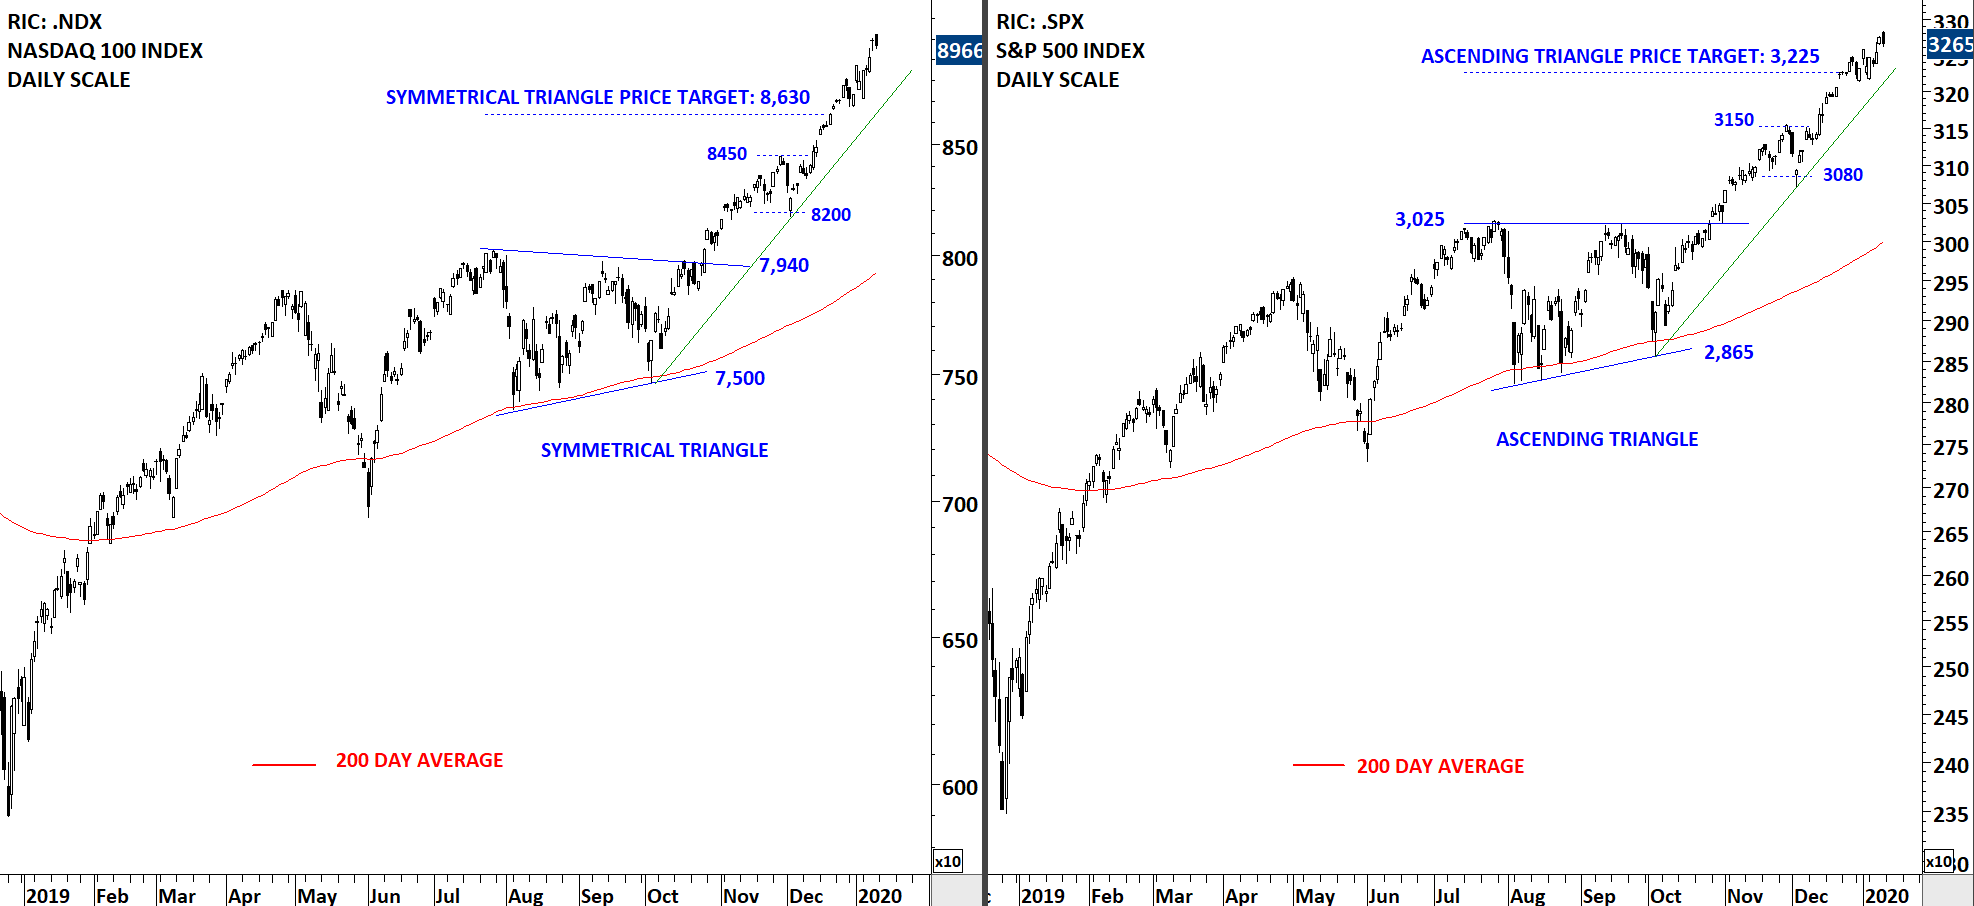
Both Nasdaq 100 and S&P 500 Index reached their price objectives after completing bullish continuation chart patterns. Earlier short-term consolidations (8,450-8,200 for Nasdaq 100) (3,150-3,080 for S&P 500 Index) can act as support during any pullback. Both charts are showing steady uptrend. Short-term setbacks are possible given the strong rally over the past month.
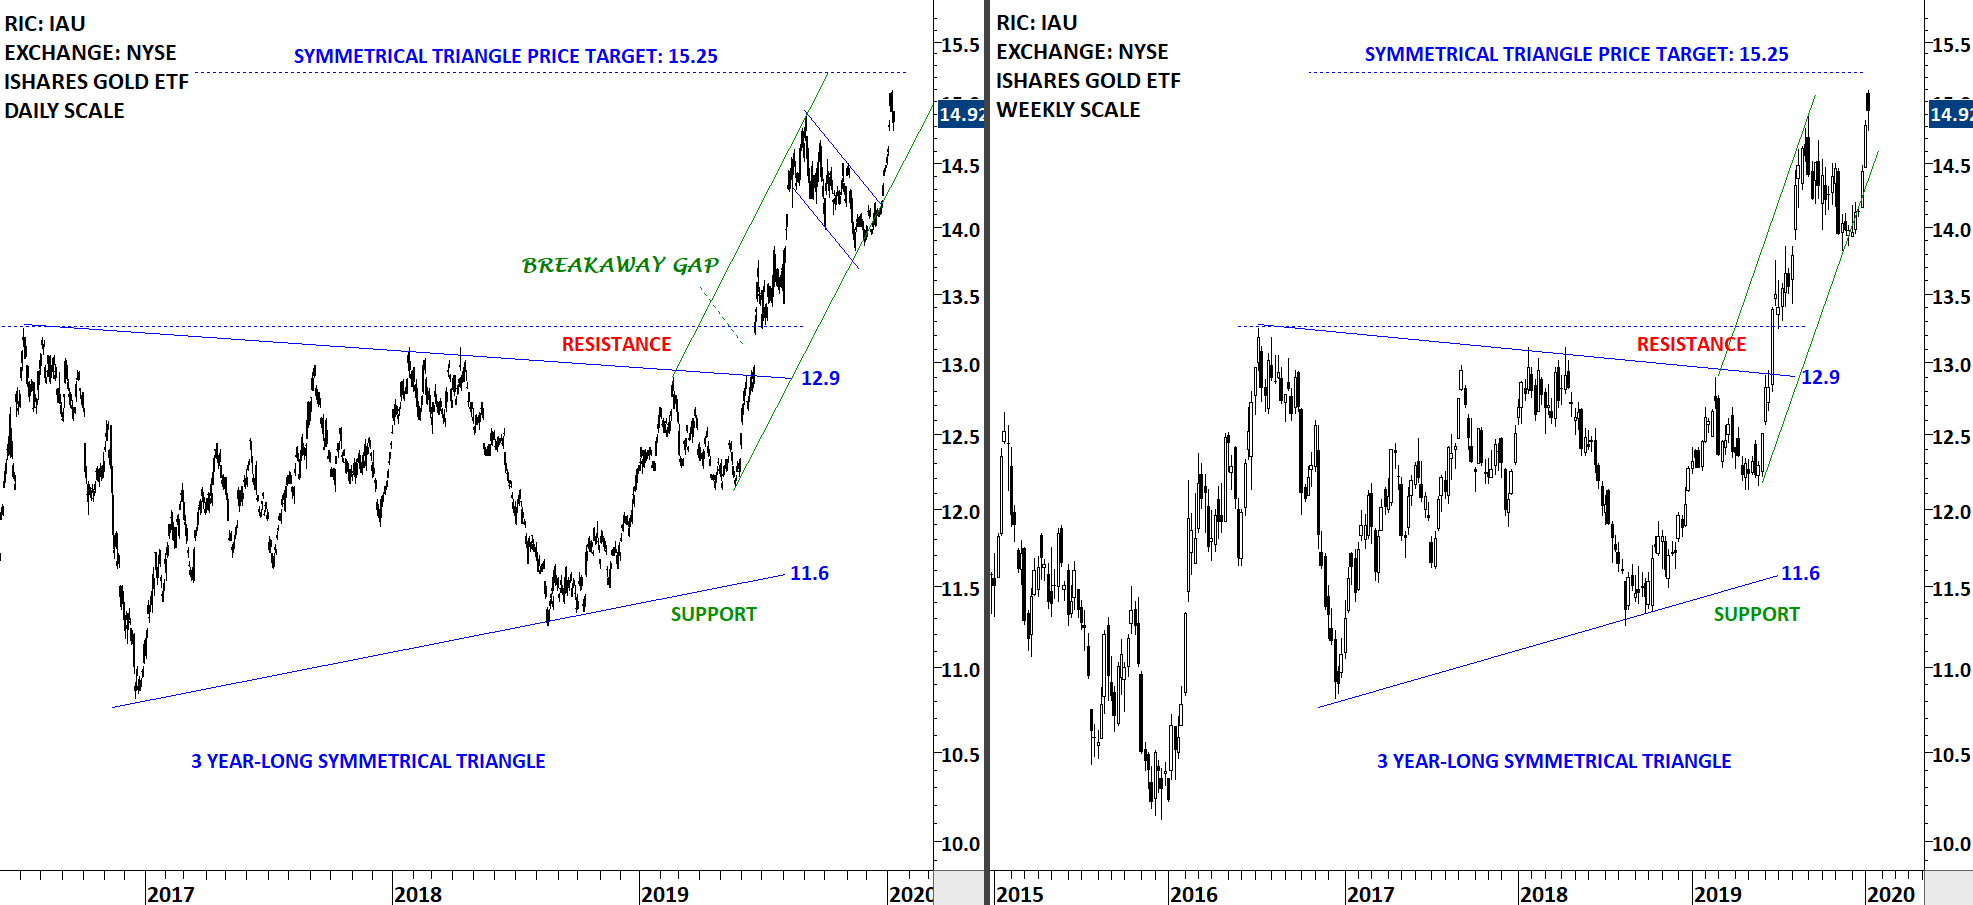
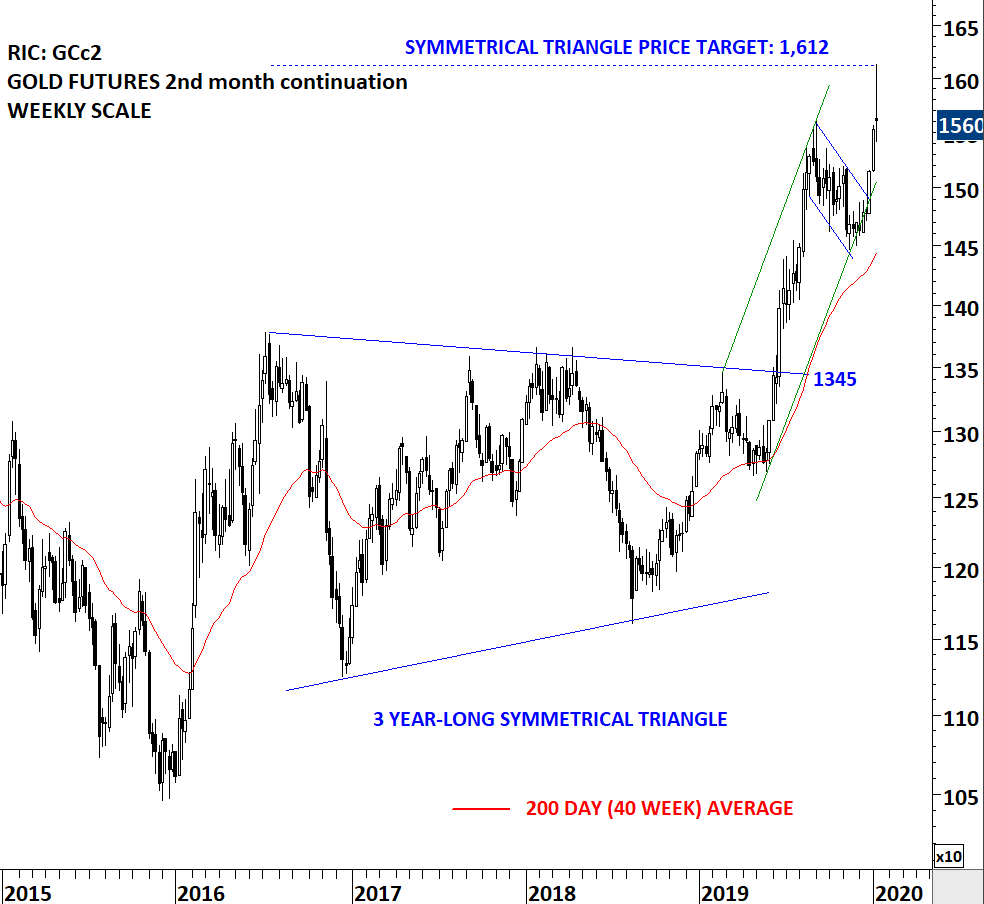
The iShares Gold ETF reached its symmetrical triangle chart pattern price target at 15.25 levels. The ETF came striking distance to the price target at 15.25 and I view this as price target met. The cash price for Gold has a similar chart pattern setup.
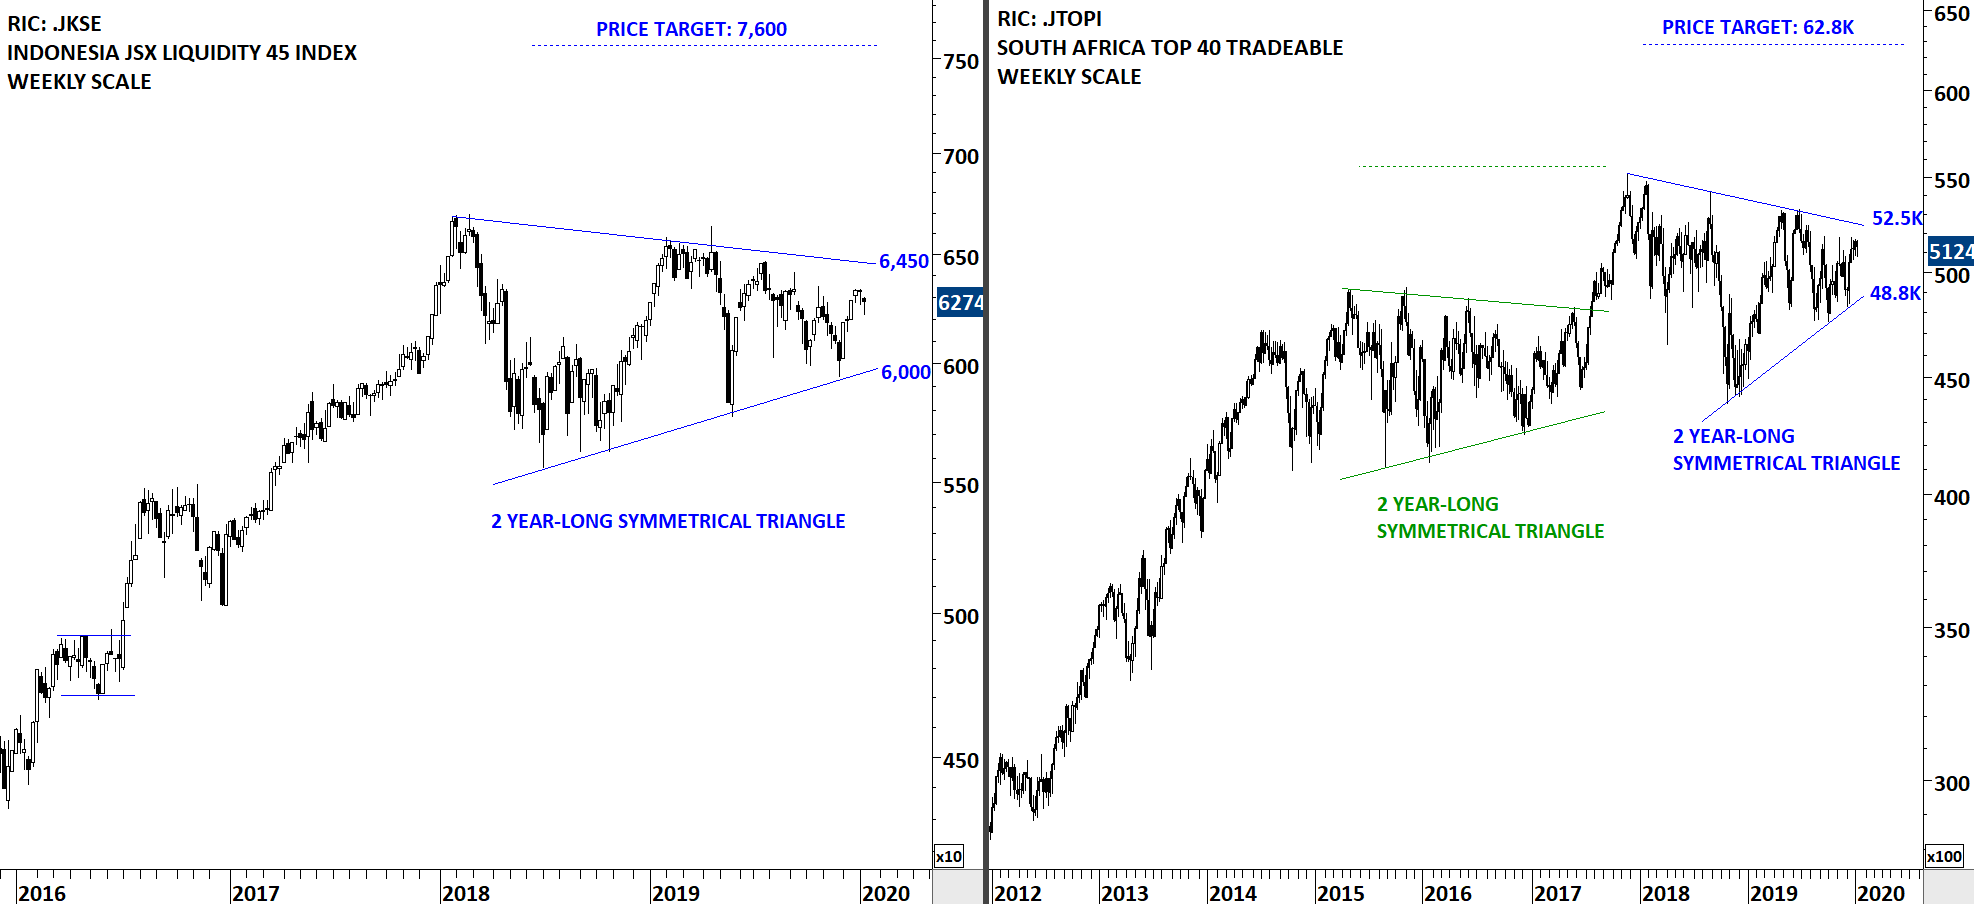
The two charts below might be of interest to our Emerging Markets investors and traders. Tech Charts have wide membership base in South Africa. In late 2017, Global Equity Markets report highlighted the long-term breakout from the 2 year-long symmetrical triangle. Since the beginning of 2018, the Top 40 tradeable index has been consolidating in a wide range. The range has narrowed over the past year which can be identified as another possible symmetrical triangle. The upper boundary of the consolidation is forming resistance at 52.5K and the lower boundary support at 48.8K. Breakout from the 2 year-long consolidation can start another trend period.
A similar consolidation is taking place on Indonesia JSX liquidity 45 Index. The upper boundary of the possible 2 year-long symmetrical triangle is forming resistance at 6,450 levels. The lower boundary is forming support at 6,000.
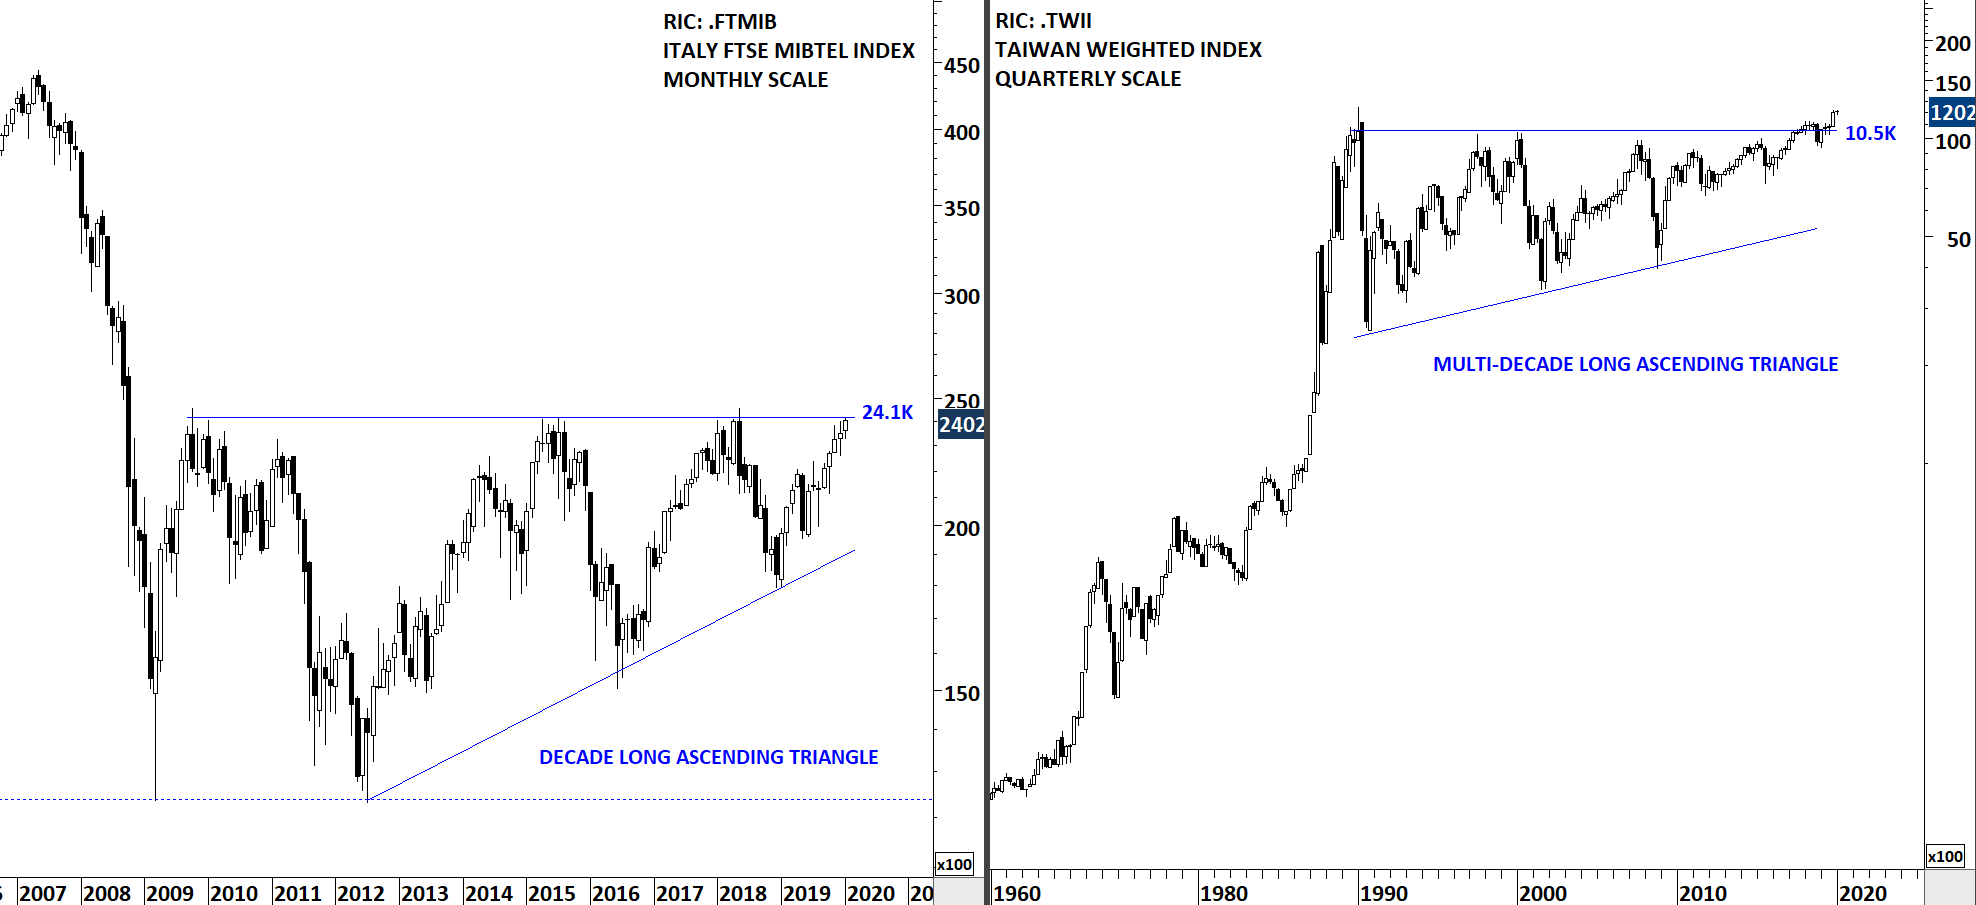
Two long-term charts drew my interest. The chart on the left is Italy’s FTSE MIBTEL Index. Price chart shows a massive ascending triangle with a well-defined horizontal boundary forming resistance at 24.1K. In the interim 24.1K should act as resistance. I will be more interested if we see a decisive breakout above this strong resistance. I will read it as long-term very positive for Italy equities.
Earlier reports highlighted the multi-decade long ascending triangle on Taiwan Weighted Index. The well-defined horizontal boundary was forming resistance at 10.5K. The index is trading above the strong multi-decade long resistance. This is another important long-term chart that has implications for Emerging Markets.
There are 7 new breakout signals.
TECH CHARTS ALERT
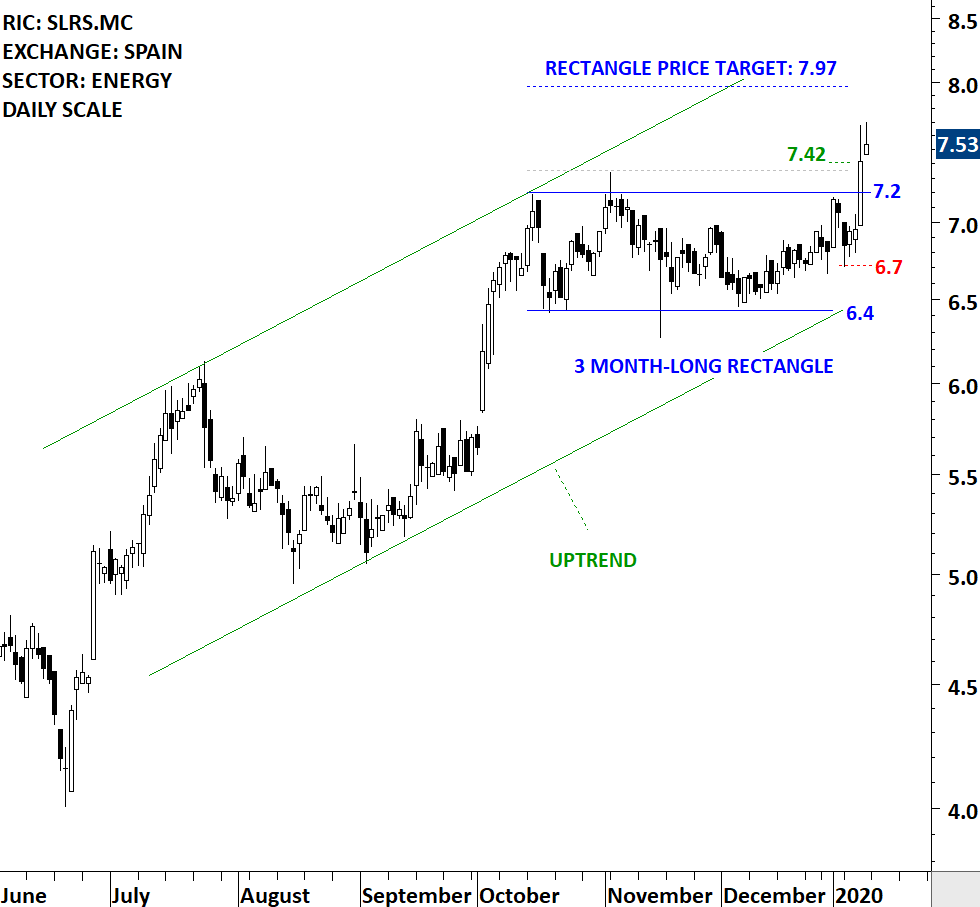
SOLARIA ENERGIA Y MEDIO AMBIENTE SA (SLRS.MC)
Solaria Energia y Medio Ambiente SA (Solaria) is a Spain-based company engaged, together with its subsidiaries, in the renewable energy sector. The Company’s activities comprise the designing and installation of solar, thermal, photovoltaic and wind energy plants. The stock is listed on the Spanish Stock Exchange. Price chart formed a 3 month-long rectangle with the horizontal boundary acting as strong resistance at 7.2 levels. The horizontal boundary was tested several times over the course of the chart pattern. The daily close above 7.4 levels confirmed the breakout from the 3 month-long rectangle with the possible chart pattern price target of 7.97 levels. (Learn more: Video Tutorial)
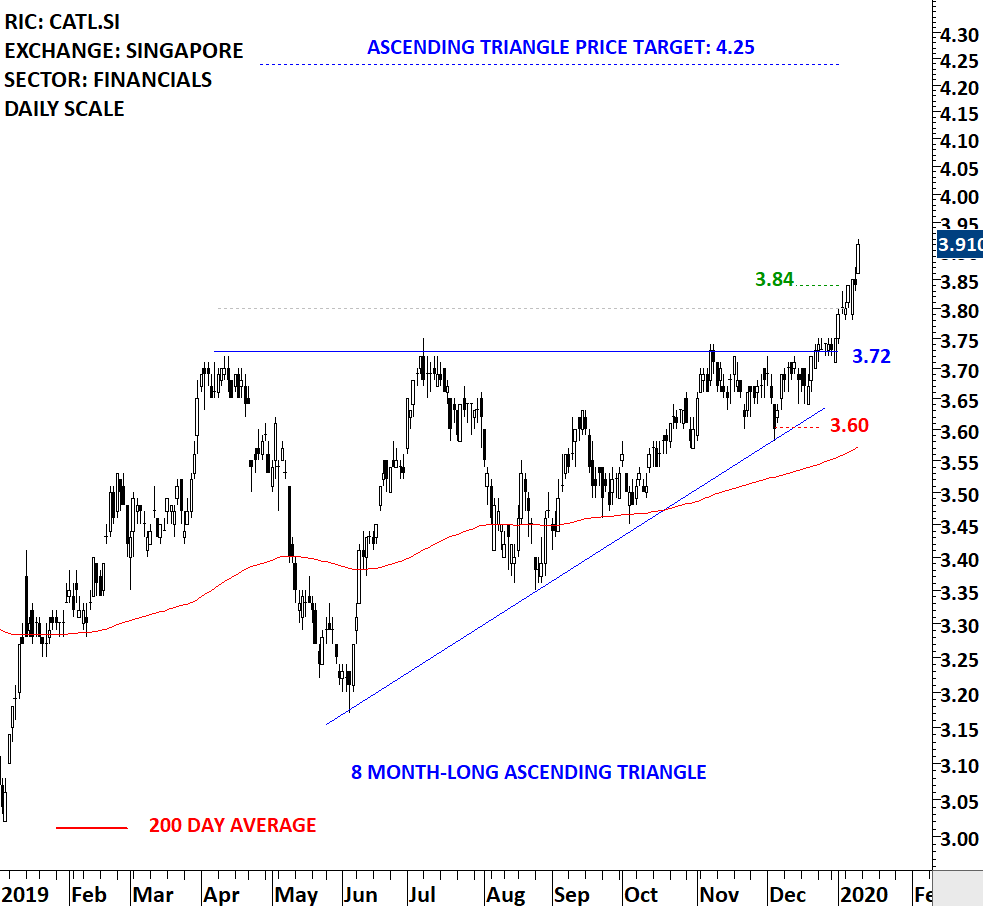
CAPITALAND LTD (CATL.SI)
CapitaLand Limited is a real estate company. The Company’s principal activities are those relating to investment holding and consultancy services, as well as the corporate headquarters, which gives direction, provides management support services and integrates the activities of its subsidiaries. The stock is listed on the Singapore Stock Exchange. Price chart formed an 8 month-long ascending triangle with the horizontal boundary acting as strong resistance at 3.72 levels. The horizontal boundary was tested several times over the course of the chart pattern. The daily close above 3.80 levels confirmed the breakout from the 8 month-long ascending triangle with the possible chart pattern price target of 4.25 levels. (Learn more: Video Tutorial)
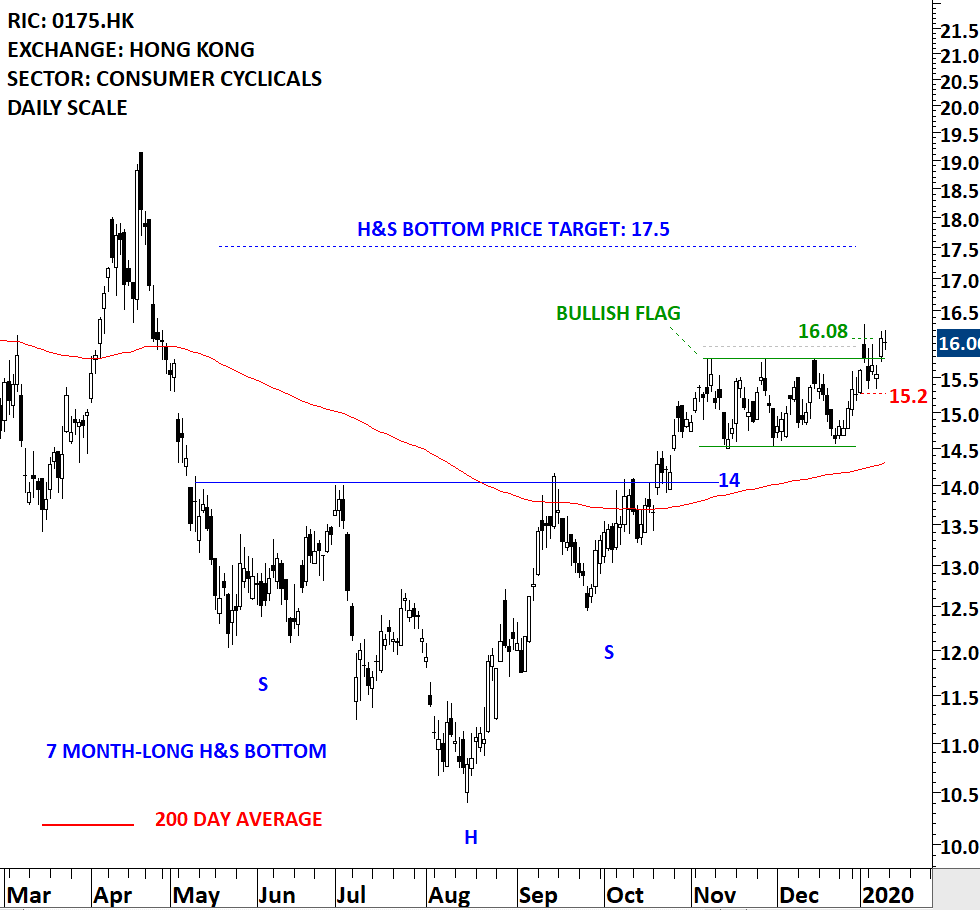
GEELY AUTOMOBILE HOLDINGS LTD (0175.HK)
Geely Automobile Holdings Limited is an investment holding company principally engaged in automobiles. The stock is listed on the Hong Kong Stock Exchange. Price chart formed a 7 month-long head and shoulder bottom with the horizontal boundary acting as strong resistance at 14.0 levels. Earlier in October the stock completed the 7 month-long H&S bottom with the price target of 17.5 levels. Since the breakout price entered into a sideways consolidation that can be identified as a possible bullish flag. The upper boundary of the flag is forming short-term resistance at 15.8 levels. The daily close above 15.95 levels confirmed the breakout from the short-term bullish continuation chart pattern. H&S bottom price target stands at 17.5 levels. Learn more about flag chart pattern. (Learn more: Video Tutorial)
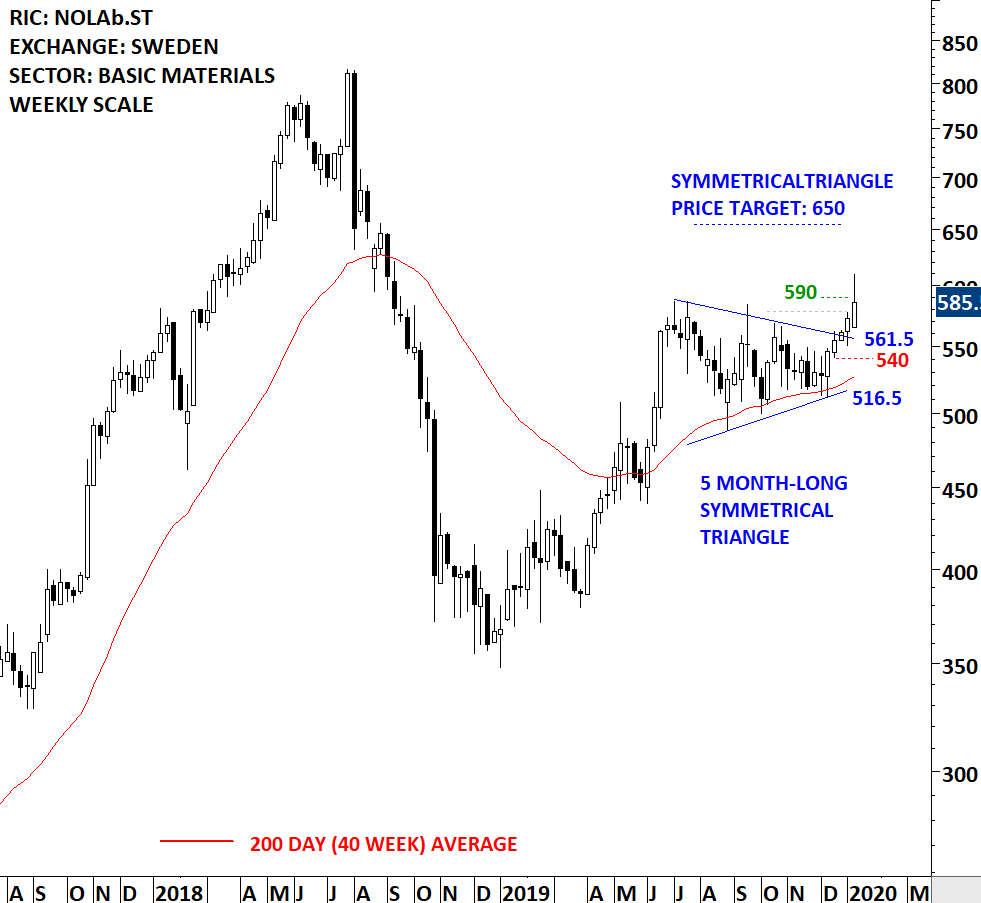
NOLATO AB (NOLAb.ST)
Nolato AB is a Sweden-based company engaged in the development, manufacture and marketing of polymer product systems and components. The stock is listed on the Stockholm Stock Exchange. Price chart formed a 5 month-long symmetrical triangle with the upper boundary acting as strong resistance at 561.5 levels. The upper boundary was tested several times over the course of the chart pattern. The daily close above 578.0 levels confirmed the breakout from the 5 month-long symmetrical triangle with the possible chart pattern price target of 650.0 levels. (Learn more: Video Tutorial)
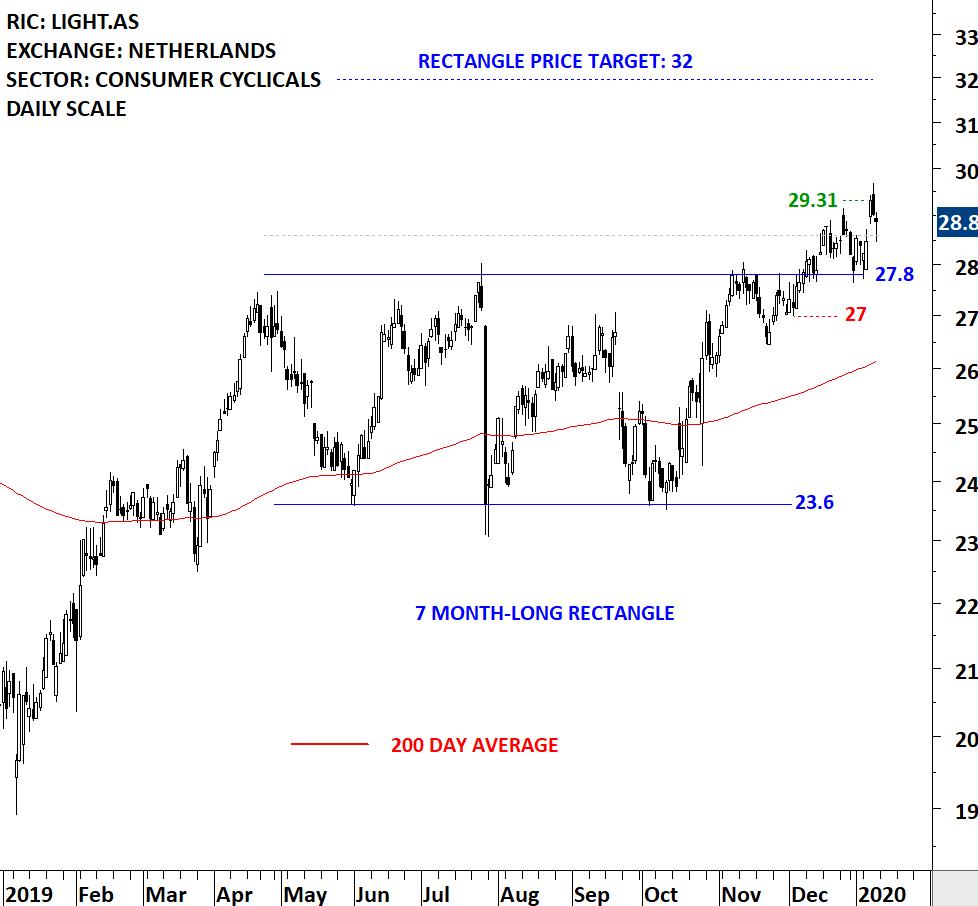
SIGNIFY NV (LIGHT.AS)
Signify NV, formerly Philips Lighting NV, is a company based in the Netherlands that provides lamps and lighting solutions. Its product portfolio includes, among others, incandescent lamps, halogen lamps, fluorescent lamps, linear fluorescent lamps (LFL), compact fluorescent lamps (CFL), high-intensity discharge lamps (HID) and light-emitting diodes (LED), as well as electronic components, such as electronic ballasts and drivers. The stock is listed on the Amsterdam Stock Exchange. Price chart formed a 7 month-long rectangle with the horizontal boundary acting as strong resistance at 27.8 levels. The horizontal boundary was tested several times over the course of the chart pattern. The daily close above 28.6 levels confirmed the breakout from the 7 month-long rectangle with the possible chart pattern price target of 32.0 levels. (Learn more: Video Tutorial)
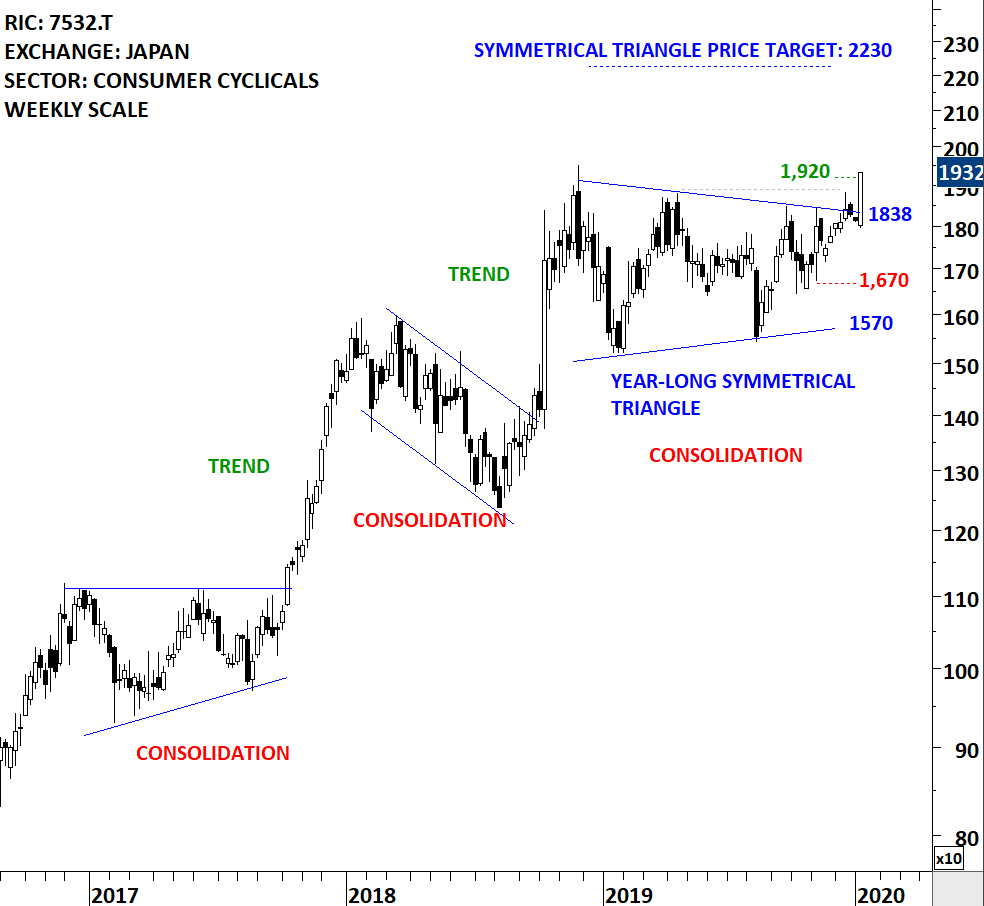
PAN PACIFIC INTERNATIONAL HOLDINGS CORP. (7532.T)
Pan Pacific International Holdings Corporation, formerly Don Quijote Holdings Co.,Ltd., is a Japan-based company mainly engaged in the retail business and tenant leasing business. The stock is listed on the Tokyo Stock Exchange. Price chart formed a year-long symmetrical triangle with the upper boundary acting as strong resistance at 1,838.0 levels. The upper boundary was tested several times over the course of the chart pattern. The daily close above 1,890.0 levels confirmed the breakout from the year-long symmetrical triangle with the possible chart pattern price target of 2,230.00 levels. The chart shows past consolidations and breakouts. Each consolidation is followed by a trend period. (Learn more: Video Tutorial)
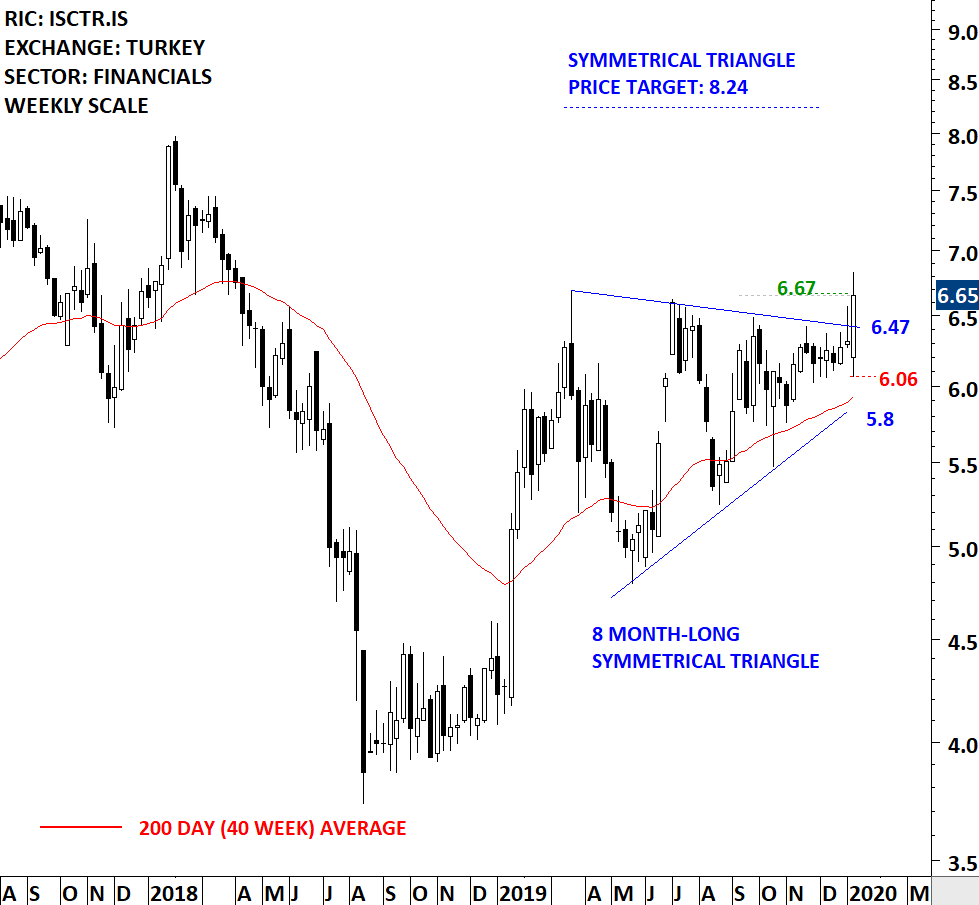
TURKIYE IS BANKASI AS (ISCTR.IS)
Turkiye Is Bankasi AS is a Turkey-based banking institution. It operates under the following business segments: Corporate, Commercial, Retail and Private Banking, as well as Treasury/Investment Banking. The stock is listed on the Istanbul Stock Exchange. Price chart formed an 8 month-long symmetrical triangle with the upper boundary acting as strong resistance at 6.47 levels. The upper boundary was tested several times over the course of the chart pattern. The daily close above 6.65 levels confirmed the breakout from the 8 month-long symmetrical triangle with the possible chart pattern price target of 8.24 levels. (Learn more: Video Tutorial)
There are 6 additions to Tech Charts watchlist.
TECH CHARTS WATCHLIST
AMERICAS
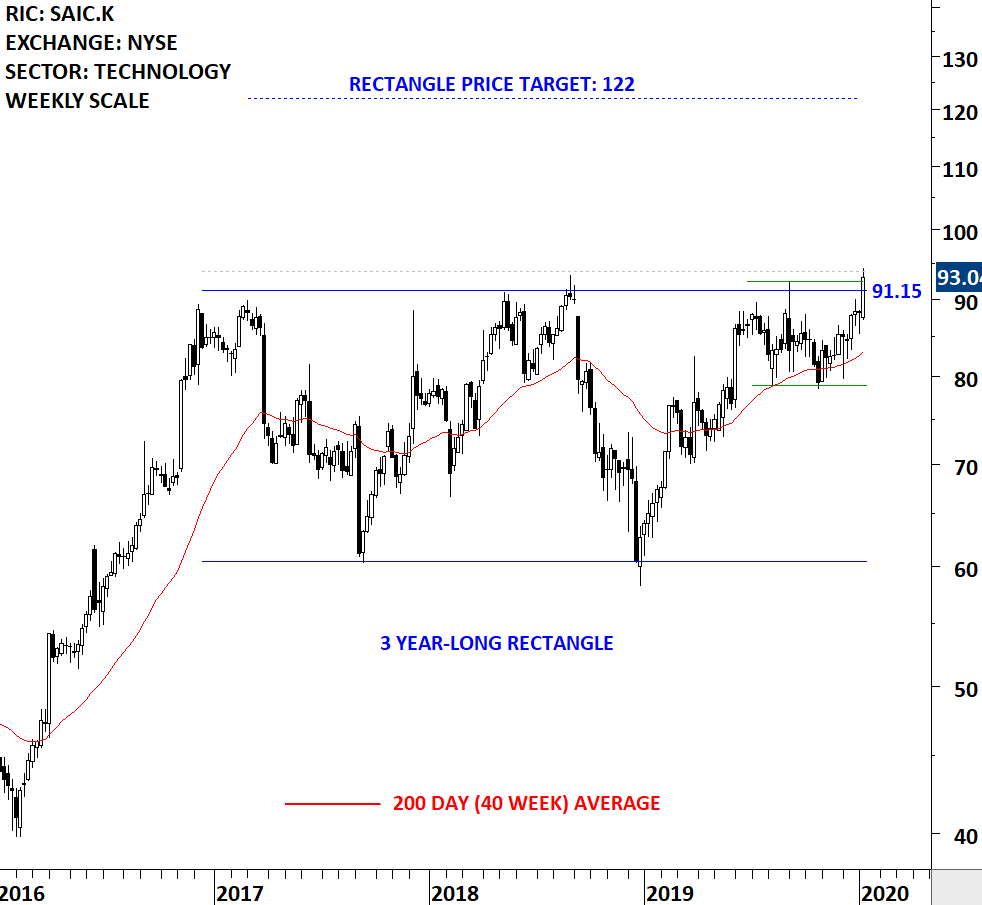
SCIENCE APPLICATIONS INTERNATIONAL CORP (SAIC.K) – new addition to watchlist
Science Applications International Corporation (SAIC) is a provider of technical, engineering and enterprise information technology (IT) services. The Company provides its services primarily to the United States Government, including the Department of Defense (DoD), the intelligence community and federal civilian agencies. The stock is listed on the New York Stock Exchange. Price chart formed a 3 year-long rectangle with the horizontal boundary acting as strong resistance at 91.15 levels. The horizontal boundary was tested several times over the course of the chart pattern. A daily close above 93.85 levels will confirm the breakout from the 3 year-long rectangle with the possible chart pattern price target of 122.00 levels. (Learn more: Video Tutorial)
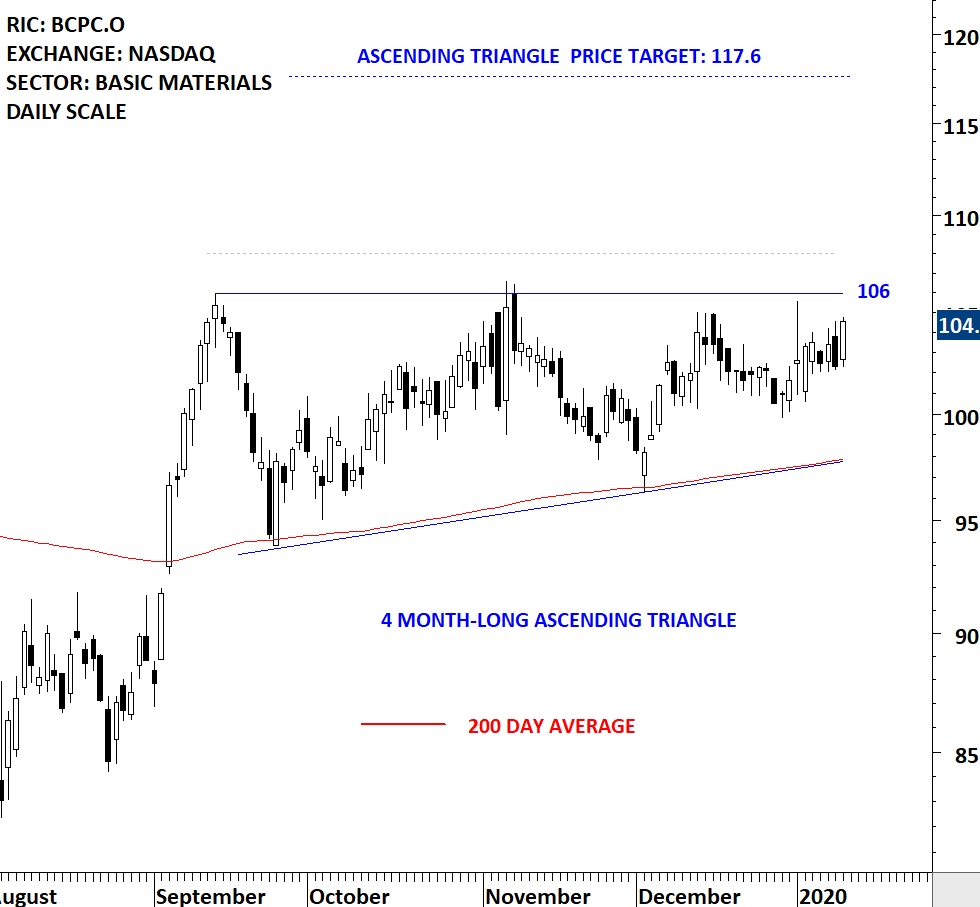
BALCHEM CORP (BCPC.O) – new addition to watchlist
Balchem Corporation is engaged in the development, manufacture and marketing of specialty performance ingredients and products for the food, nutritional, feed, pharmaceutical, medical sterilization and industrial markets. The stock is listed on the Nasdaq Stock Exchange. Price chart formed a 4 month-long ascending triangle with the horizontal boundary acting as strong resistance at 106.0 levels. The horizontal boundary was tested several times over the course of the chart pattern. A daily close above 108.0 levels will confirm the breakout from the 4 month-long ascending triangle with the possible chart pattern price target of 117.6 levels. (Learn more: Video Tutorial)
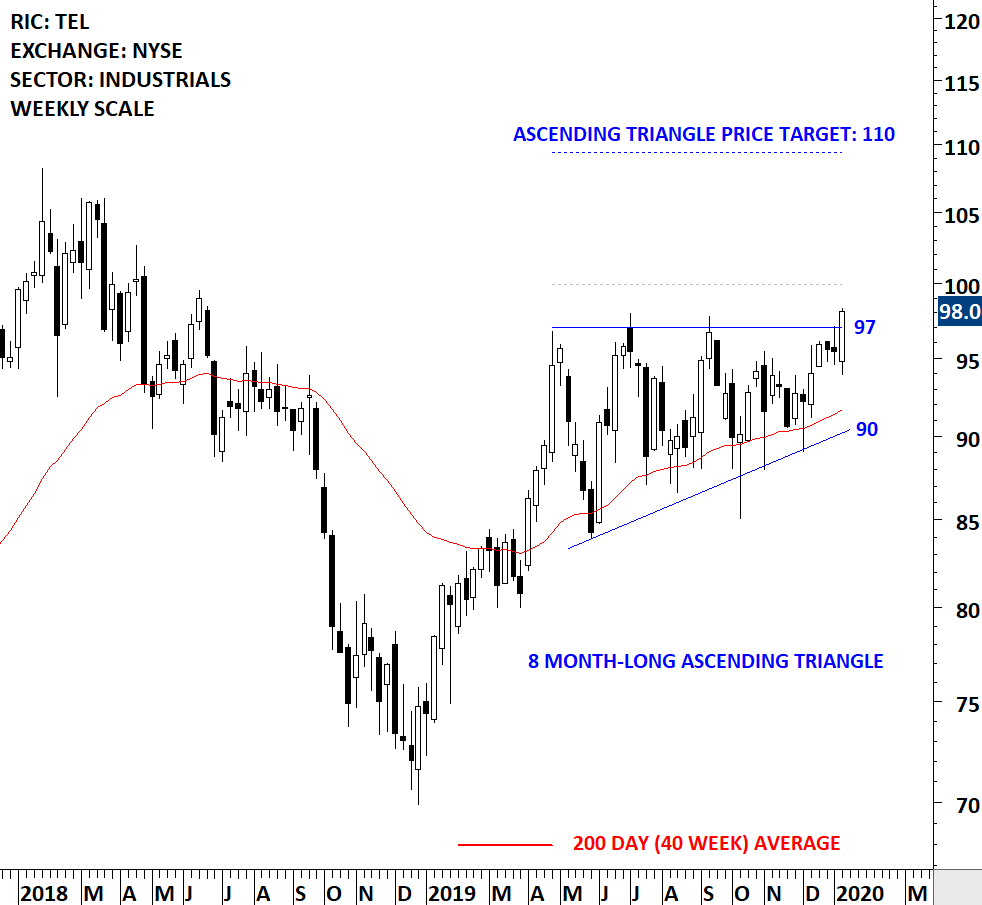
TE CONNECTIVITY LTD (TEL)
TE Connectivity Ltd. is a technology company. The Company designs and manufactures connectivity and sensors solutions. The stock is listed on the New York Stock Exchange. Price chart formed a 8 month-long ascending triangle with the horizontal boundary acting as strong resistance at 97.0 levels. The horizontal boundary was tested several times over the course of the chart pattern. A daily close above 100.0 levels will confirm the breakout from the 8 month-long ascending triangle with the possible chart pattern price target of 110.0 levels. (Learn more: Video Tutorial)
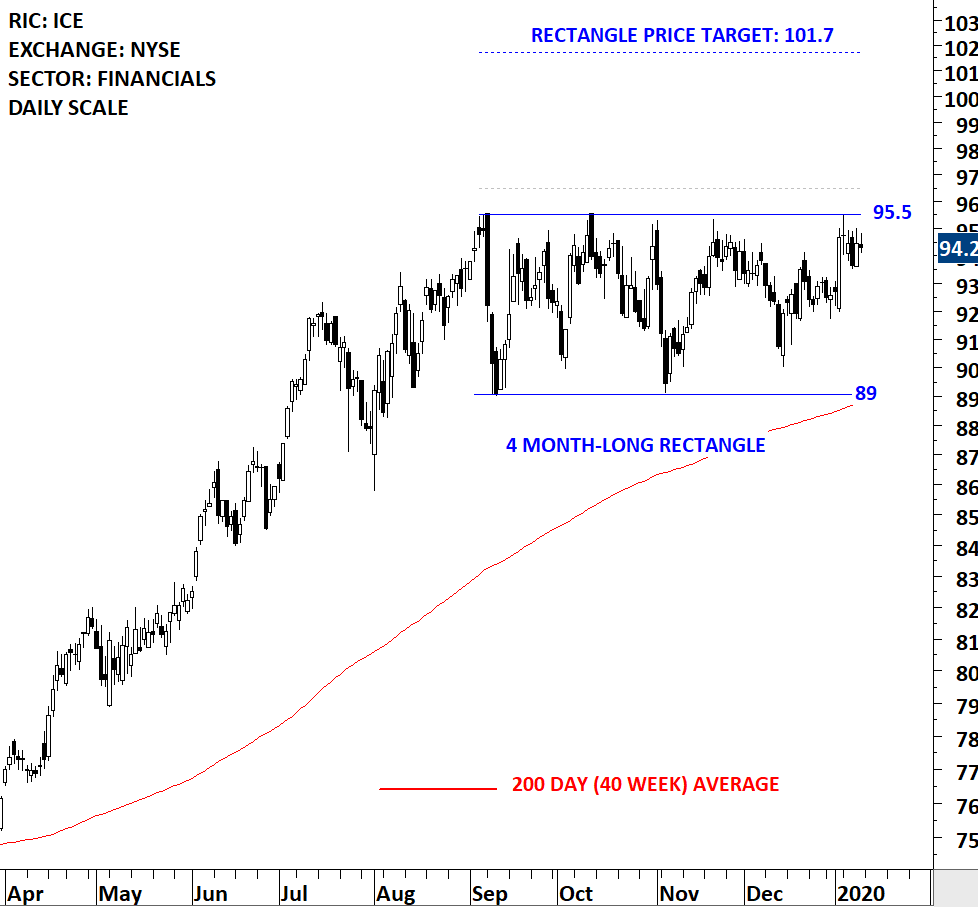
INTERCONTINENTAL EXCHANGE INC (ICE)
Intercontinental Exchange, Inc. is an operator of regulated exchanges, clearing houses and listings venues. The Company provides data services for commodity and financial markets. The stock is listed on the New York Stock Exchange. Price chart formed a 4 month-long rectangle with the horizontal boundary acting as strong resistance at 95.50 levels. The horizontal boundary was tested several times over the course of the chart pattern. A daily close above 96.50 levels will confirm the breakout from the 4 month-long rectangle with the possible chart pattern price target of 101.70 levels. (Learn more: Video Tutorial)
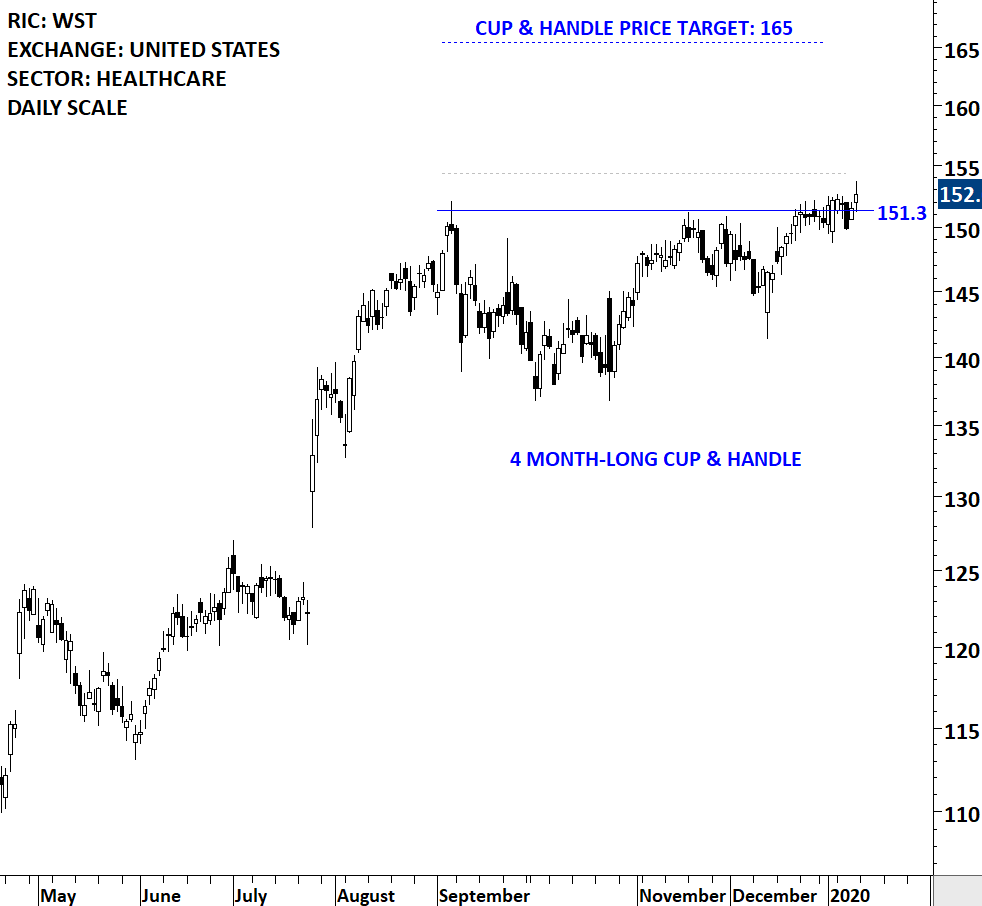
WEST PHARMACEUTICAL SERVICES INC (WST)
West Pharmaceutical Services, Inc. is a manufacturer of packaging components and delivery systems for injectable drugs and healthcare products. The stock is listed on the New York Stock Exchange. Price chart formed a 4 month-long cup & handle continuation with the horizontal boundary acting as strong resistance at 151.30 levels. The horizontal boundary was tested several times over the course of the chart pattern. A daily close above 154.30 levels will confirm the breakout from the 4 month-long cup & handle continuation with the possible chart pattern price target of 165.00 levels. (Learn more: Video Tutorial)
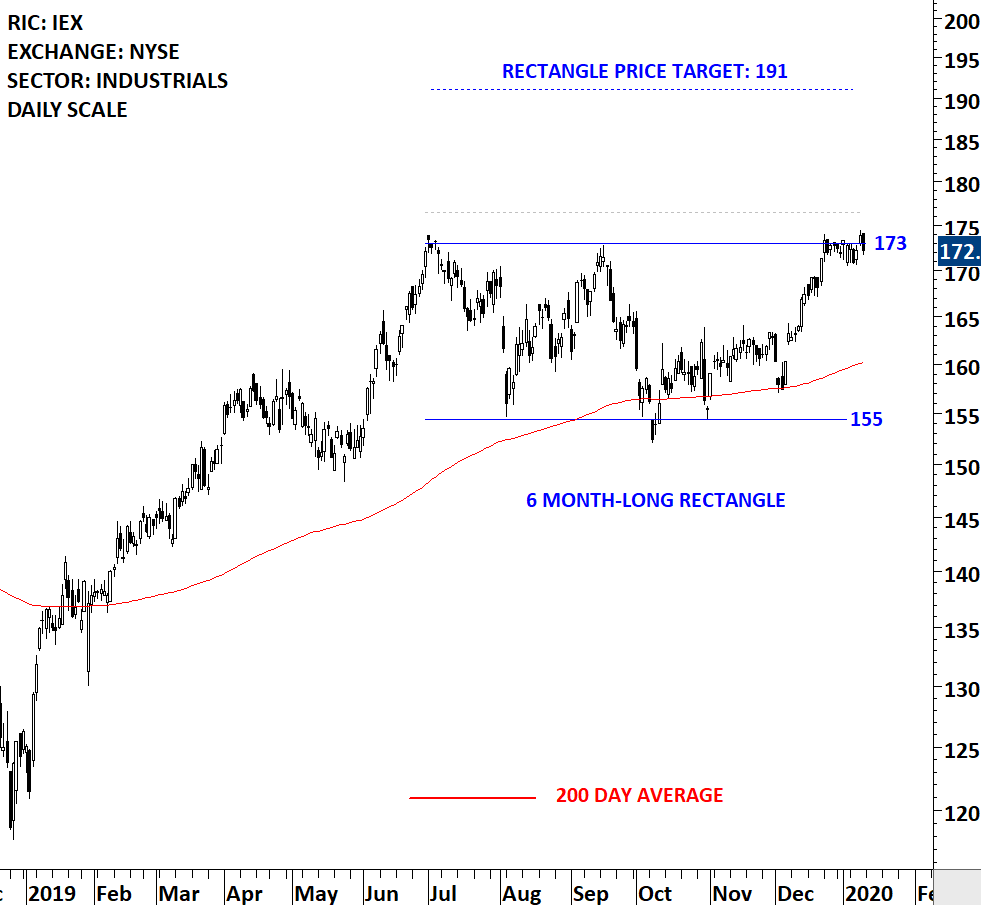
IDEX CORP (IEX)
IDEX Corporation (IDEX) operates an applied solutions business that sells pumps, flow meters and other fluidics systems, and components and engineered products. The stock is listed on the New York Stock Exchange. Price chart formed a 6 month-long rectangle with the horizontal boundary acting as strong resistance at 173.00 levels. The horizontal boundary was tested several times over the course of the chart pattern. A daily close above 176.50 levels will confirm the breakout from the 6 month-long rectangle with the possible chart pattern price target of 191.00 levels. (Learn more: Video Tutorial)
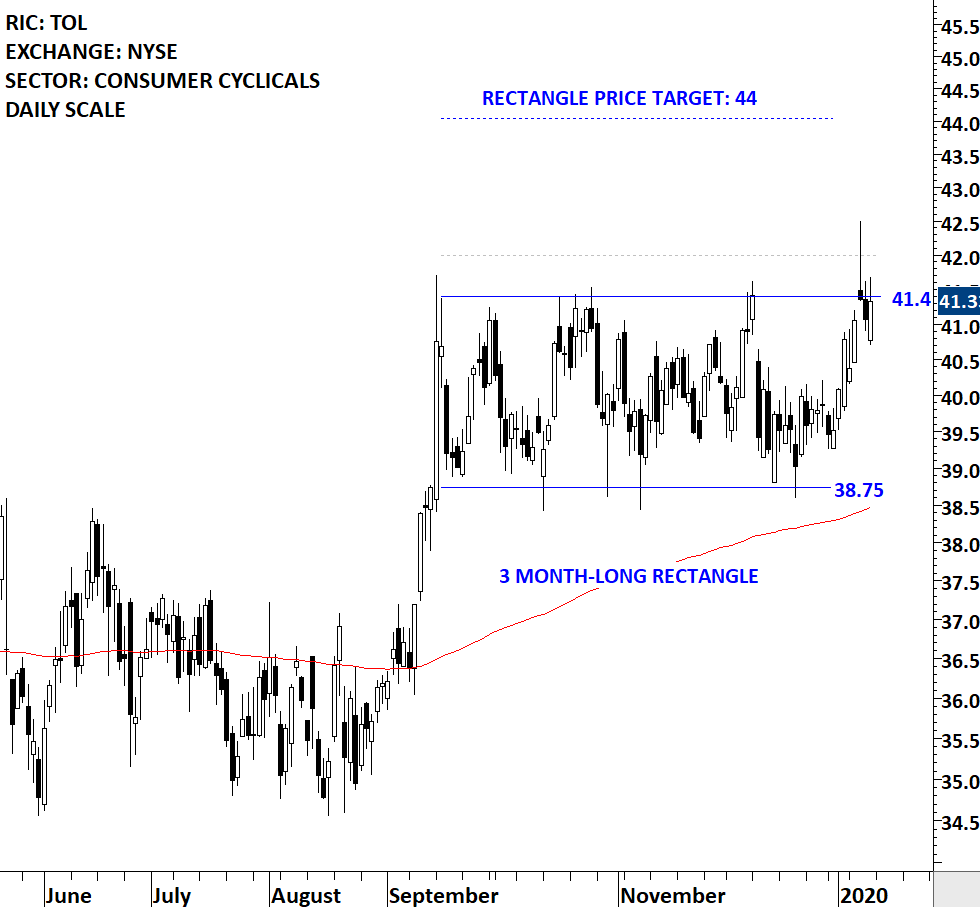
TOLL BROTHERS INC (TOL)
Toll Brothers, Inc. is engaged in designing, building, marketing, selling and arranging financing for detached and attached homes in luxury residential communities. The stock is listed on the New York Stock Exchange. Price chart formed a 3 month-long rectangle with the horizontal boundary acting as strong resistance at 41.40 levels. The horizontal boundary was tested several times over the course of the chart pattern. A daily close above 42.00 levels will confirm the breakout from the 3 month-long rectangle with the possible chart pattern price target of 44.00 levels. (Learn more: Video Tutorial)
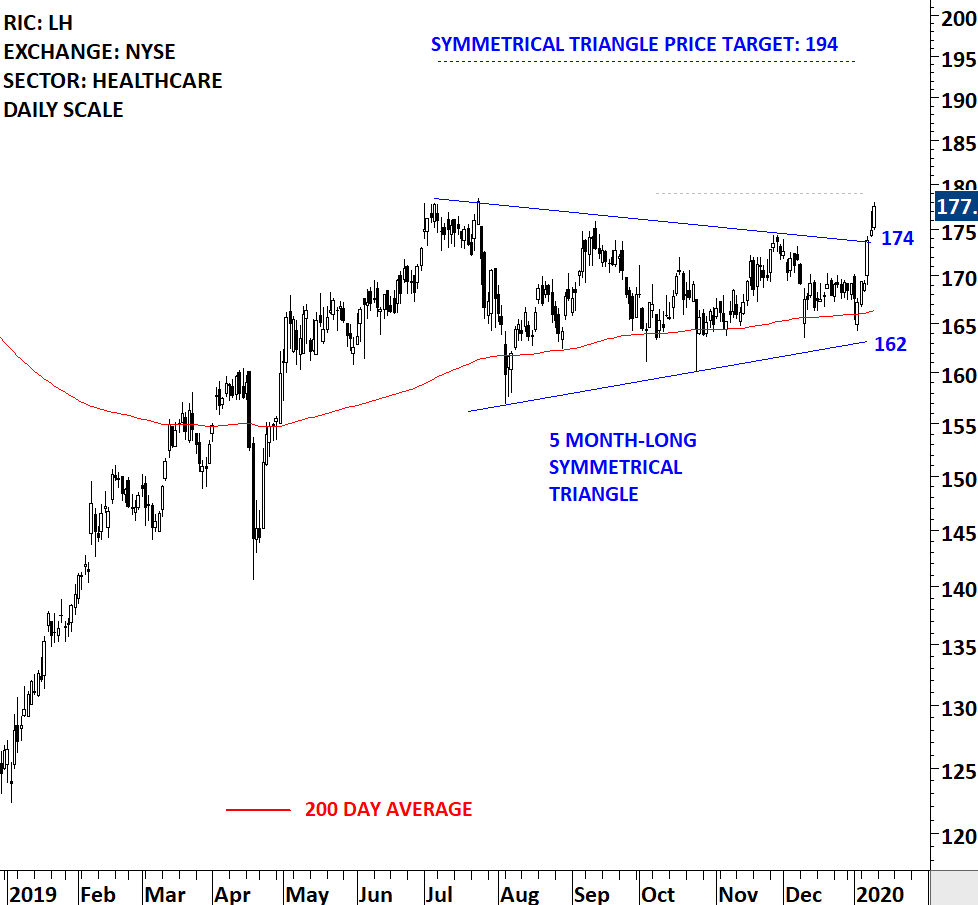
LABORATORY CORPORATION OF AMERICA HOLDINGS (LH)
Laboratory Corporation of America Holdings is a life sciences company that is integrated in guiding patient care, providing clinical laboratory and end-to-end drug development services. The Company operates as a healthcare diagnostics company. The stock is listed on the New York Stock Exchange. Price chart formed a 5 month-long symmetrical triangle with the upper boundary acting as strong resistance at 174.00 levels. Both boundaries were tested several times over the course of the chart pattern. A daily close above 179.00 levels will confirm the breakout from the 5 month-long symmetrical triangle with the possible chart pattern price target of 194.00 levels. Friday’s price action was strong. Another strong daily close can confirm the breakout.(Learn more: Video Tutorial)
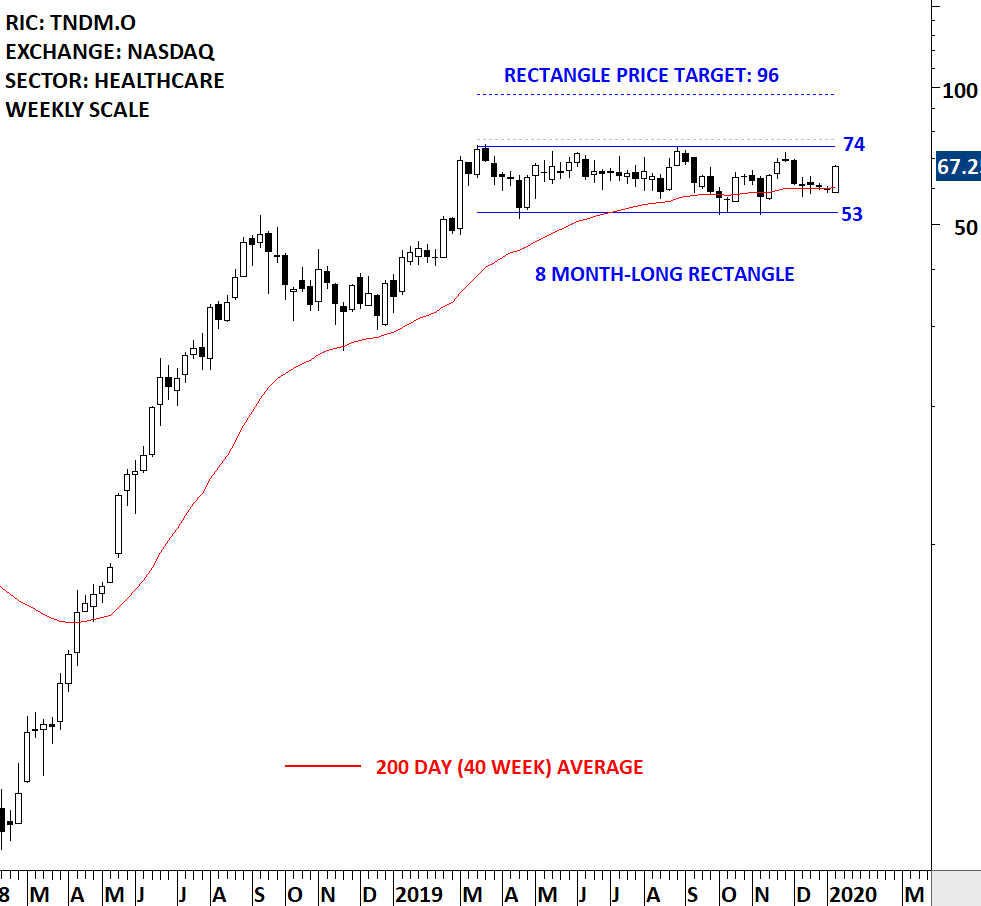
TANDEM DIABETES CARE INC (TNDM.O)
Tandem Diabetes Care, Inc. is a medical device company. The Company is engaged in designing, developing and commercializing products for people with insulin-dependent diabetes. The stock is listed on the Nasdaq Stock Exchange. Price chart formed an 8 month-long rectangle with the horizontal boundary acting as strong resistance at 74.0 levels. The horizontal boundary was tested several times over the course of the chart pattern. A daily close above 77.0 levels will confirm the breakout from the 8 month-long rectangle with the possible chart pattern price target of 96.00 levels. (Learn more: Video Tutorial)
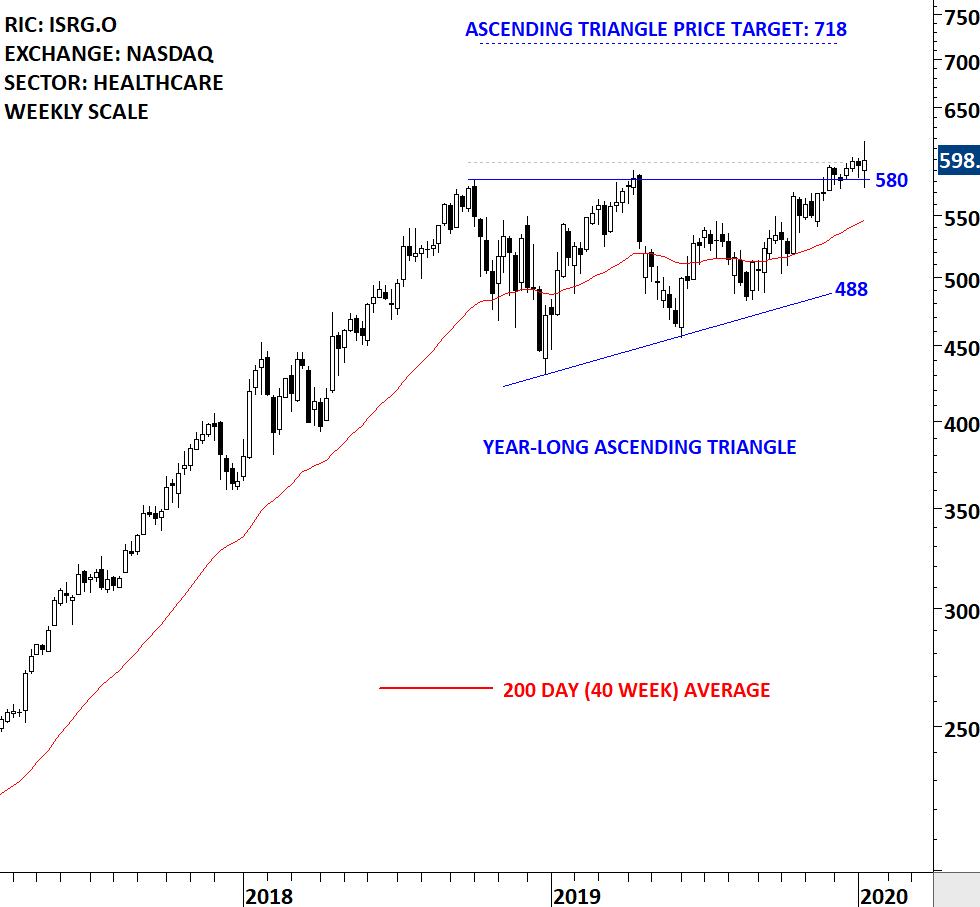
INTUITIVE SURGICAL INC (ISRG.O)
Intuitive Surgical, Inc. (Intuitive) designs, manufactures and markets da Vinci Surgical Systems, and related instruments and accessories. The stock is listed on the Nasdaq Stock Exchange. Price chart formed a year-long ascending triangle with the horizontal boundary acting as strong resistance at 580.0 levels. The horizontal boundary was tested several times over the course of the chart pattern. A daily close above 597.0 levels will confirm the breakout from the year-long ascending triangle with the possible chart pattern price target of 718.00 levels. Breakout can push the stock to all-time highs. Friday’s close was questionable with a gap opening and a sell-off to the end of the session. I will wait for another day of strength to confirm this as a breakout. (Learn more: Video Tutorial)
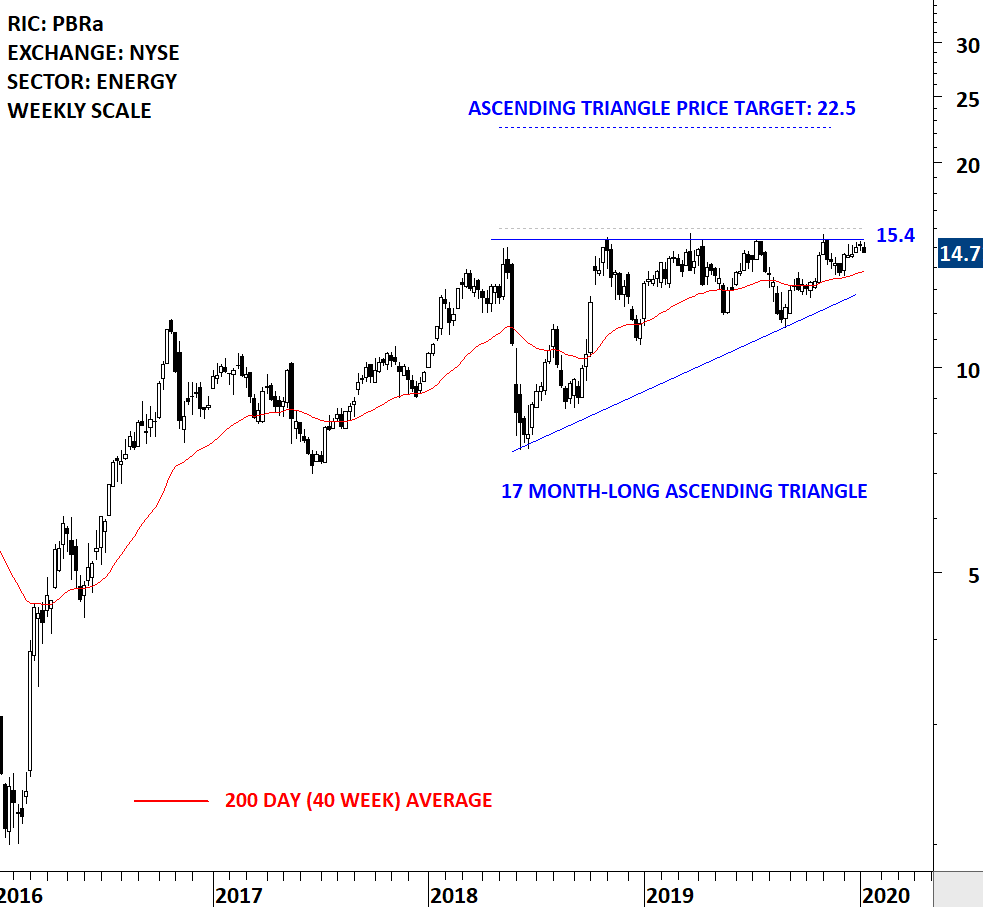
PETROLEO BRASILEIRO SA PETROBRAS (PBRa)
Petroleo Brasileiro S.A.-Petrobras specializes in the oil, natural gas and energy industry. The Company is engaged in prospecting, drilling, refining, processing, trading and transporting crude oil from producing onshore and offshore oil fields and from shale or other rocks. The stock is listed on the New York Stock Exchange. Price chart formed a 17 month-long ascending triangle with the horizontal boundary acting as strong resistance at 15.40 levels. The horizontal boundary was tested several times over the course of the chart pattern. A daily close above 16 levels will confirm the breakout from the 17 month-long ascending triangle with the possible chart pattern price target of 22.50 levels. (Learn more: Video Tutorial)
EUROPE
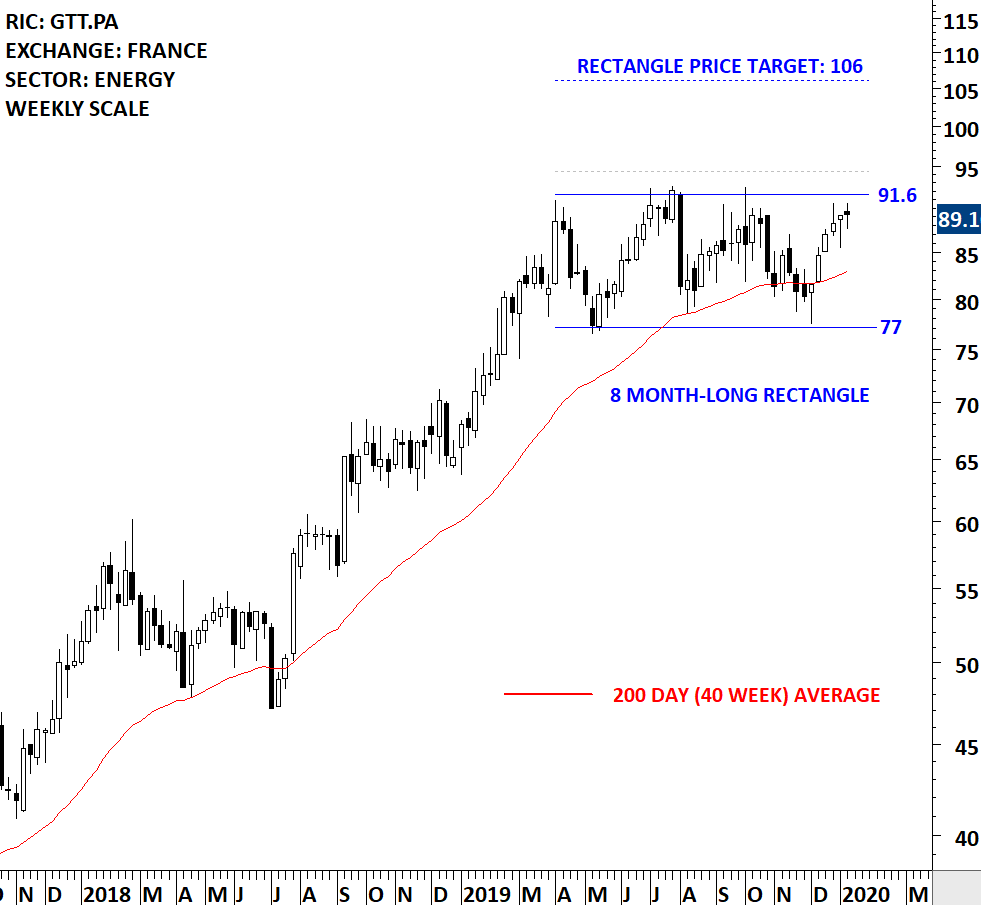
GAZTRANSPORT ET TECHNIGAZ SA (GTT.PA) – new addition to watchlist
Gaztransport et Technigaz SA is a France-based engineering company specialized in containment systems for the shipping and storage in cryogenic conditions of LNG (liquefied natural gas). The stock is listed on the Paris Stock Exchange. Price chart formed an 8 month-long rectangle with the horizontal boundary acting as strong resistance at 91.60 levels. The horizontal boundary was tested several times over the course of the chart pattern. A daily close above 94.40 levels will confirm the breakout from the 8 month-long rectangle with the possible chart pattern price target of 106.00 levels. (Learn more: Video Tutorial)
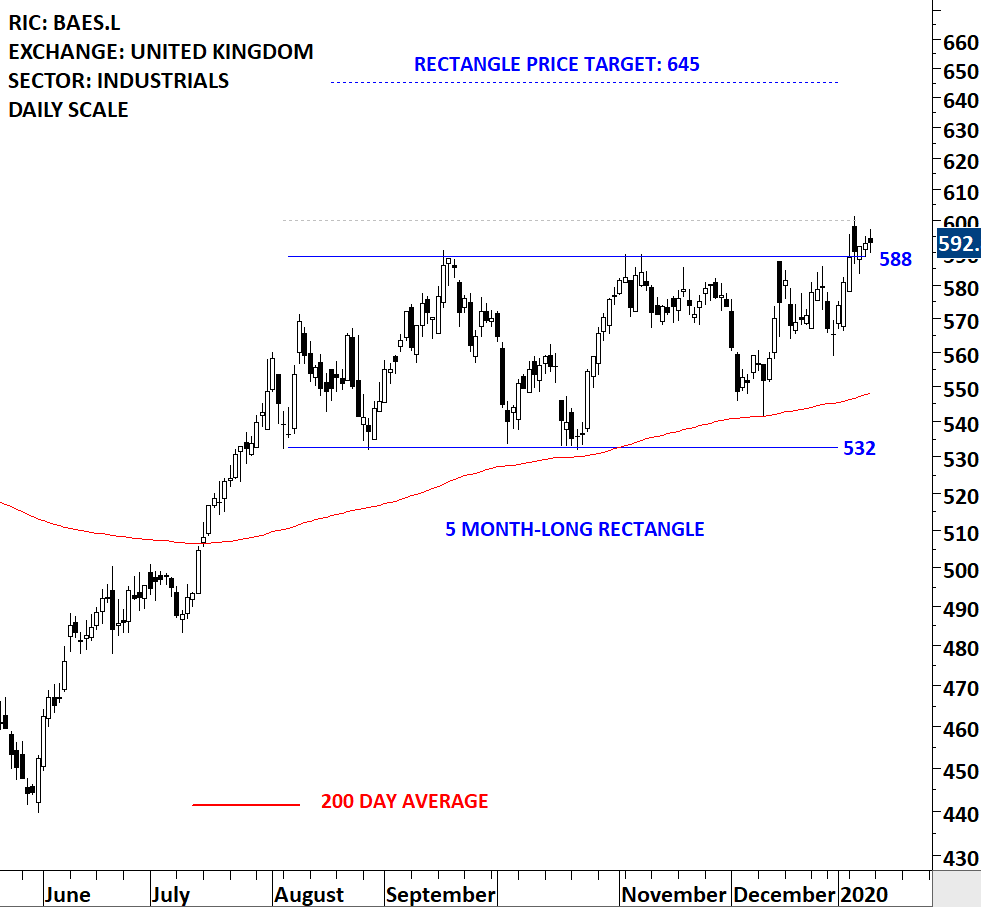
BAE SYSTEMS PLC (BAES.L)
BAE Systems plc is a defense, aerospace and security company. The stock is listed on the London Stock Exchange. Price chart formed a 5 month-long rectangle with the horizontal boundary acting as strong resistance at 588.0 levels. The horizontal boundary was tested several times over the course of the chart pattern. A daily close above 600.0 levels will confirm the breakout from the 5 month-long rectangle with the possible chart pattern price target of 645.0 levels. (Learn more: Video Tutorial)
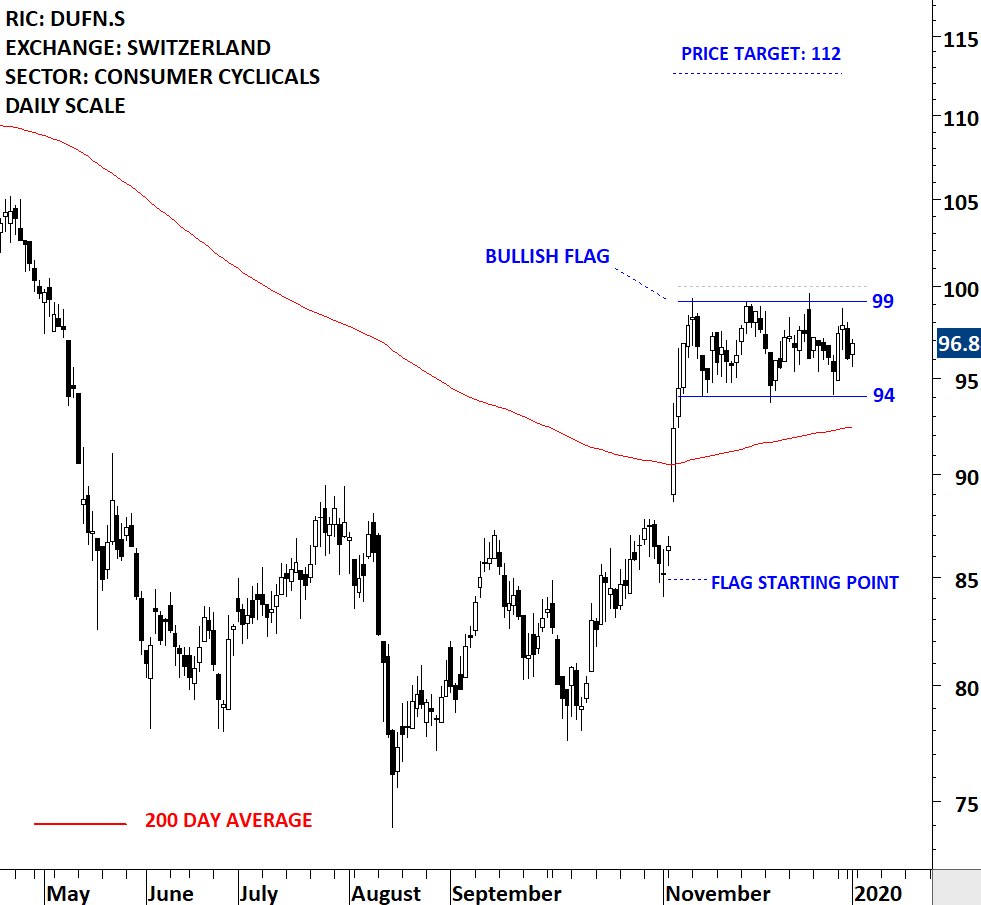
DUFRY AG (DUFN.S)
Dufry AG is a Switzerland-based retail company engaged in the travel retail sector. The Company operates around 1200 shops located at airports, cruise liners, seaports, and other touristic locations. The stock is listed on the Swiss Stock Exchange. Price chart formed a 1 month-long flag with the horizontal boundary acting as strong resistance at 99.0 levels. The horizontal boundary was tested several times over the course of the chart pattern. A daily close above 100.0 levels will confirm the breakout from the 1 month-long flag with the possible chart pattern price target of 112.0 levels. Learn more about flag chart pattern.
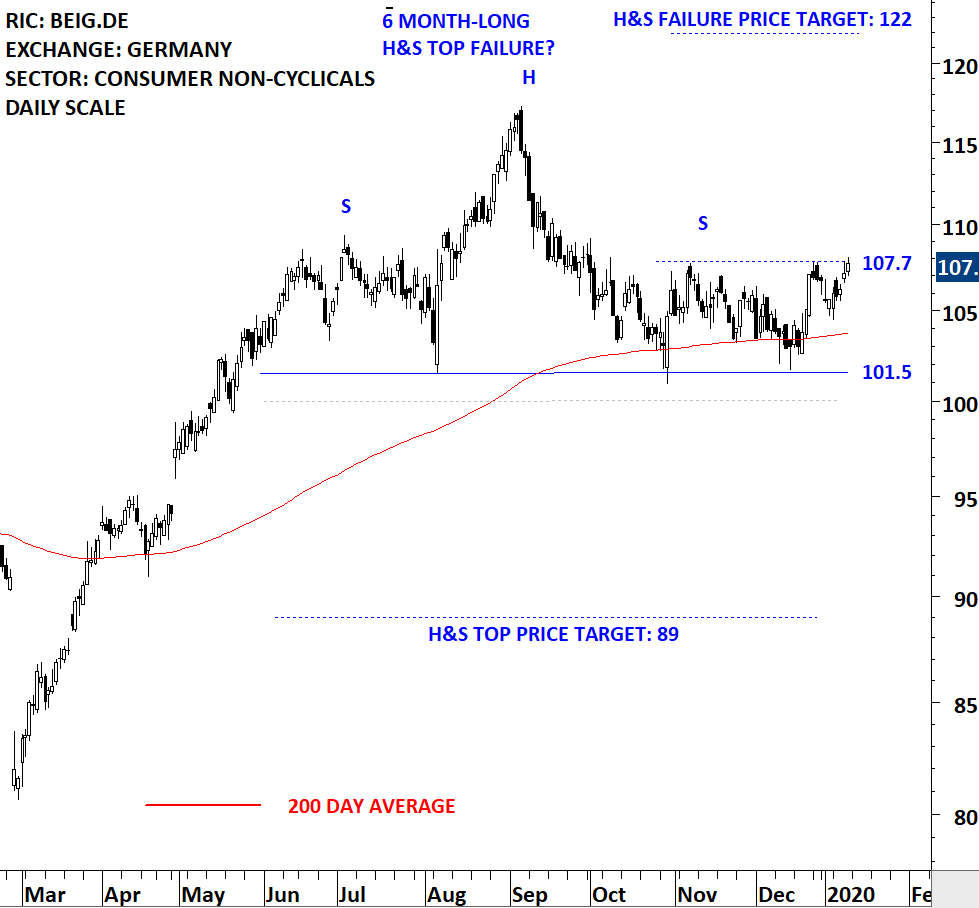
BEIERSDORF AG (BEIG.DE)
Beiersdorf AG is a Germany-based manufacturer of chemical consumer goods, with a focus on personal products and cosmetics. The stock is listed on the Frankfurt Stock Exchange. Price chart formed a 6 month-long head and shoulder top with the horizontal boundary acting as strong support at 101.5 levels. The horizontal boundary (neckline) was tested several times over the course of the chart pattern. A daily close below 100.0 levels will confirm the breakdown from the 6 month-long head and shoulder top with the possible chart pattern price target of 89.0 levels. A breach above 107.7 levels will put the bearish interpretation in question possibly resulting in a H&S top failure.(Learn more: Video Tutorial) Learn more about H&S top failures
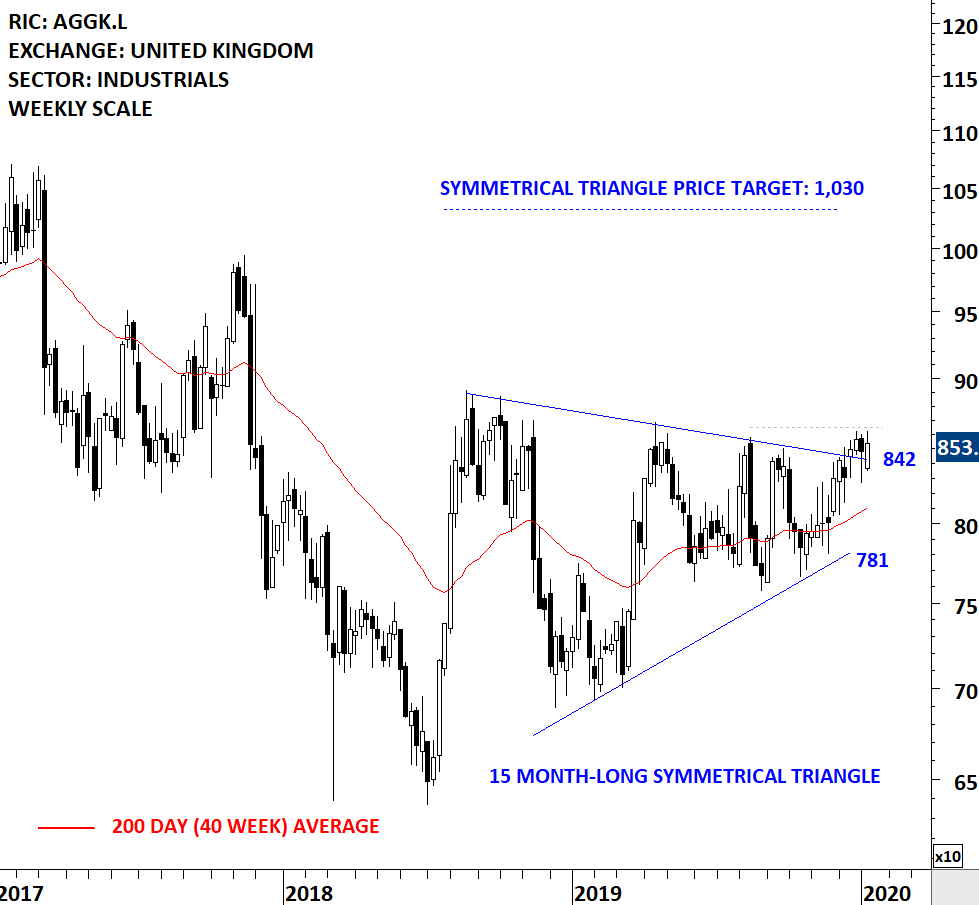
AGGREKO PLC (AGGK.L)
Aggreko plc is a United Kingdom-based company, which is a provider of modular, mobile power and related solutions. The Company’s segments include Power Solutions and Rental Solutions. The stock is listed on the London Stock Exchange. Price chart formed a 15 month-long symmetrical triangle with the upper boundary acting as strong resistance at 842.0 levels. The upper boundary was tested several times over the course of the chart pattern. A daily close above 865.0 levels will confirm the breakout from the 15 month-long symmetrical triangle with the possible chart pattern price target of 1,030.0 levels. (Learn more: Video Tutorial)
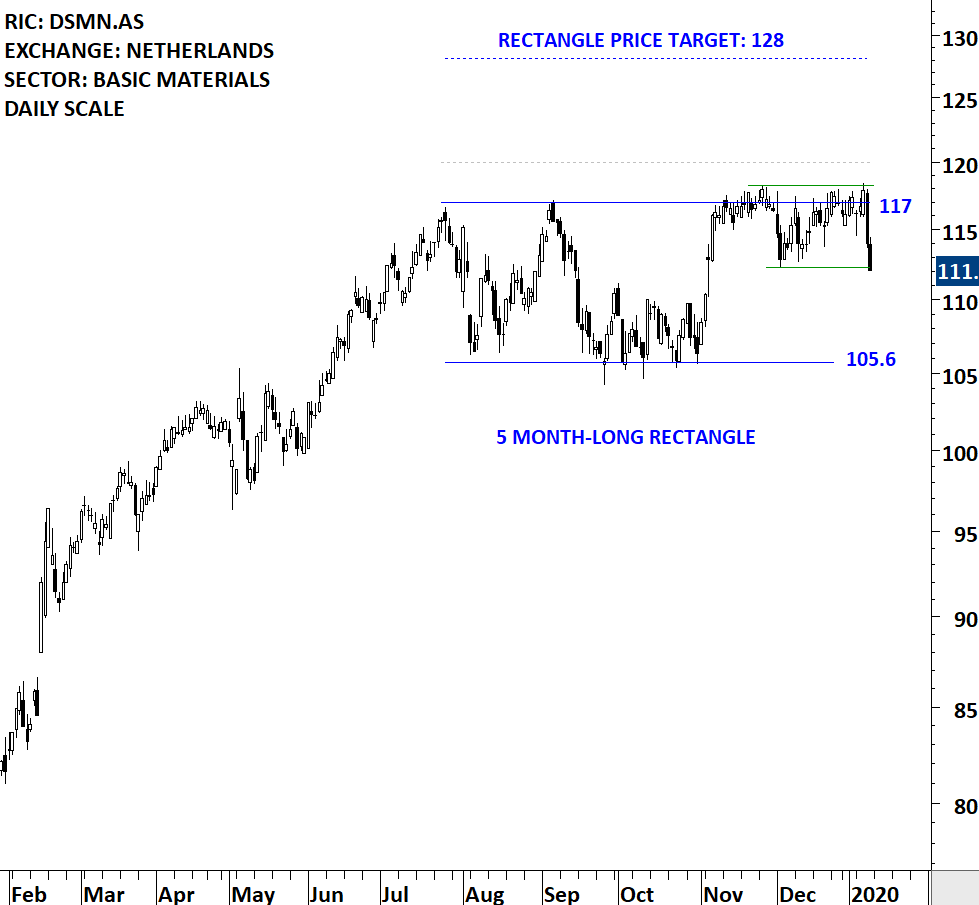
KONINKLIJKE DSM NV (DSMN.AS)
Koninklijke DSM N.V. (Royal DSM) is a global science-based company, engaged in offering health, nutrition and materials. The Company’s segments include Nutrition, Performance Materials, Innovation Center and Corporate Activities. The stock is listed on the Amsterdam Stock Exchange. Price chart formed a 4 month-long rectangle with the horizontal boundary acting as strong resistance at 117.0 levels. The horizontal boundary was tested several times over the course of the chart pattern. A daily close above 120.0 levels will confirm the breakout from the 4 month-long rectangle with the possible chart pattern price target of 128.0 levels. (Learn more: Video Tutorial)
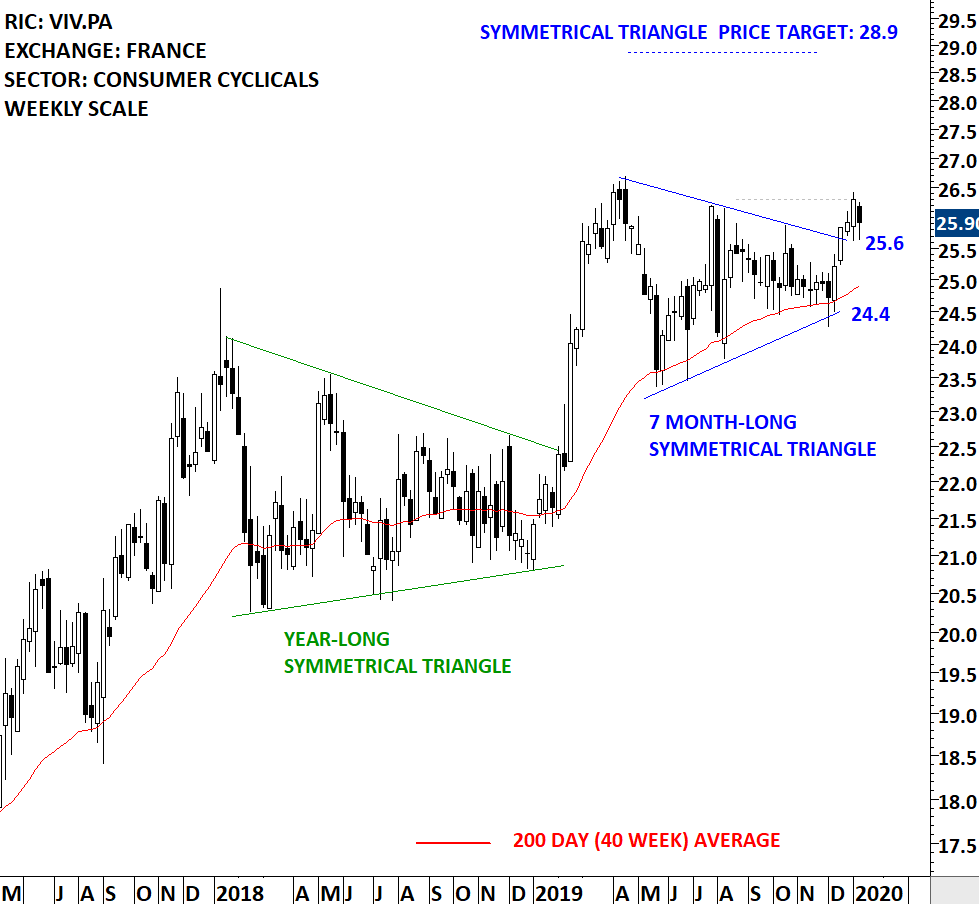
VIVENDI SA (VIV.PA)
Vivendi SA is a France-based company engaged in media and content businesses. It operates businesses throughout the media value chain, from talent discovery to the creation, production and distribution of content. The stock is listed on the Paris Stock Exchange. Price chart formed a 7 month-long symmetrical triangle with the upper boundary acting as strong resistance at 25.75 levels. The upper boundary was tested several times over the course of the chart pattern. A daily close above 26.3 levels will confirm the breakout from the 7 month-long symmetrical triangle with the possible chart pattern price target of 28.9 levels. (Learn more: Video Tutorial)
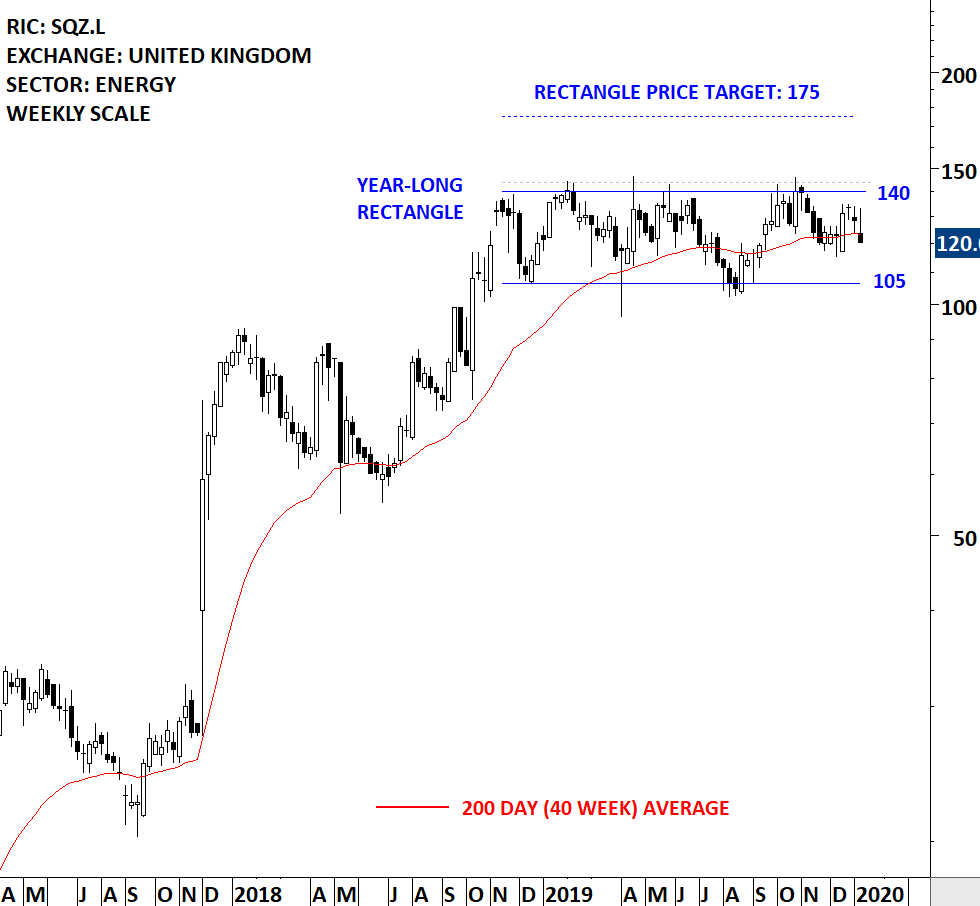
SERICA ENERGY PLC (SQZ.L)
Serica Energy plc is a United Kingdom-based oil and gas company. The Company has exploration and development activities based in the United Kingdom, Ireland, Namibia and Morocco, and an economic interest in an oilfield offshore Norway. The stock is listed on the London Stock Exchange. Price chart formed a year-long rectangle with the horizontal boundary acting as strong resistance at 140 levels. The horizontal boundary was tested several times over the course of the chart pattern. A daily close above 144 levels will confirm the breakout from the year-long rectangle with the possible chart pattern price target of 175 levels. (Learn more: Video Tutorial)
MIDDLE EAST & AFRICA
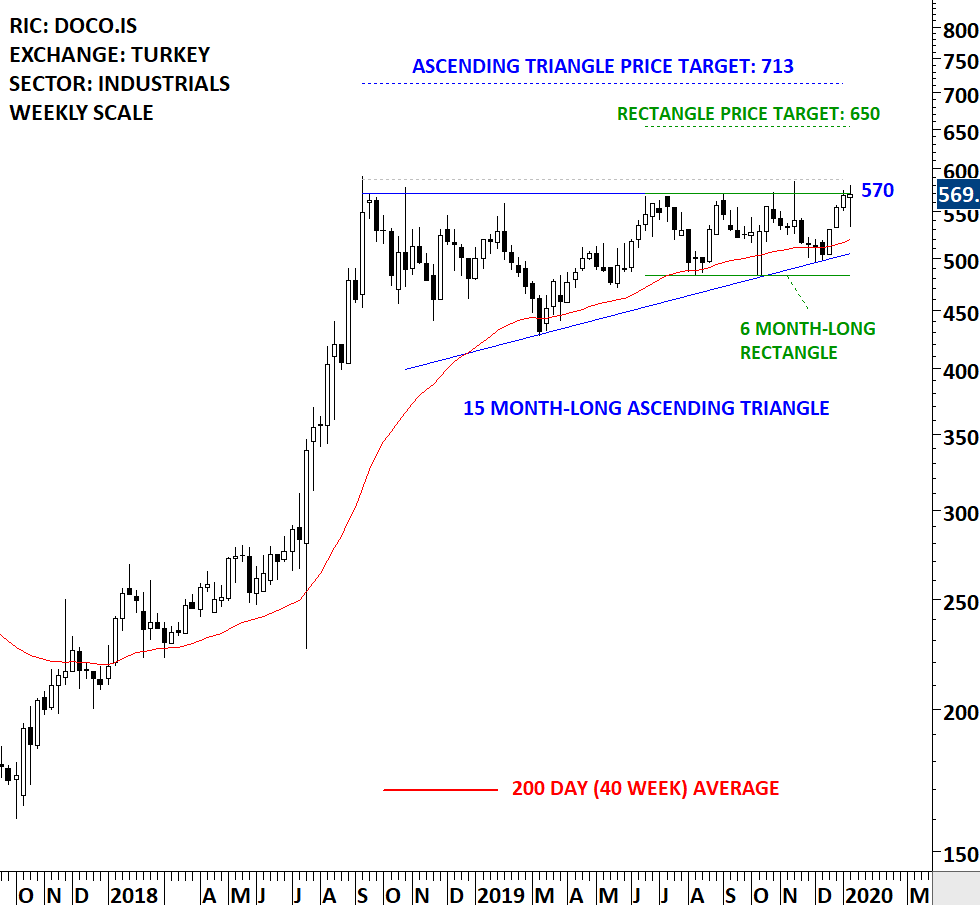
DO & CO AG (DOCO.IS)
DO & CO AG is an Austria-based company that provides catering services. The Company’s activities are divided into three operating segments: Airline Catering, which provides airline catering services for passengers of more than 60 airline companies; International Event Catering, which provides event catering and infrastructure services, offering one-stop solutions at events that include logistics, decoration, furniture, tents, music, entertainment and lighting in addition to traditional catering, as well as Restaurants, Lounges & Hotel, which engages in the operation of restaurants and Demel cafes, lounges, hotels, and staff restaurants, and retail, airport gastronomy and railway catering businesses. The Company offers its services in Austria, Turkey, the United States, Germany and internationally. The stock is listed on the Istanbul Stock Exchange. Price chart formed a 15 month-long ascending triangle with the horizontal boundary acting as strong resistance at 570.0 levels. The horizontal boundary was tested several times over the course of the chart pattern. A daily close above 587.0 levels will confirm the breakout from the 15 month-long ascending triangle with the possible chart pattern price target of 713.0 levels. (Learn more: Video Tutorial)
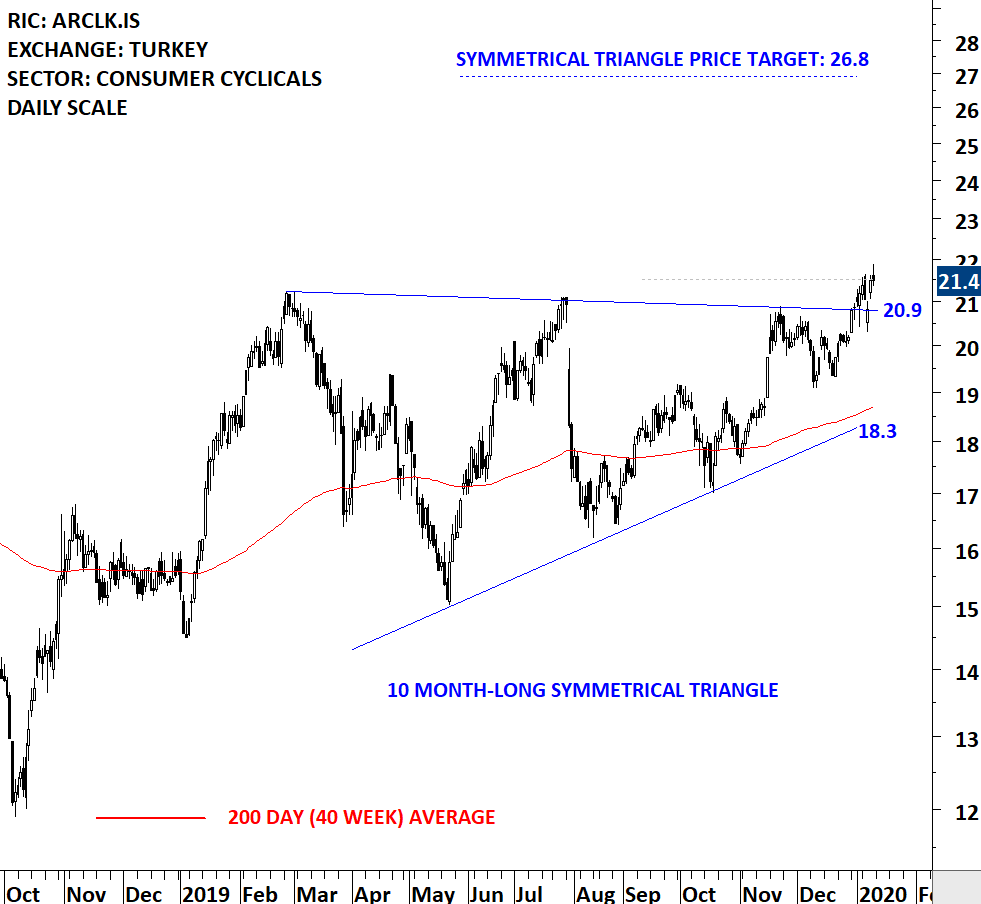
ARCELIK AS (ARCLK.IS)
Arcelik AS is a Turkey-based company, which is engaged in the production, sales and marketing, customer services after sales, exportation and importation of consumer durable goods and consumer electronics. The Group operates more than 17 manufacturing plants in Turkey, Romania, Russia, China, Republic of South Africa, Thailand and Pakistan. It operates under the following business segments: White Goods, Consumer Electronics and Other. The stock is listed on the Istanbul Stock Exchange. Price chart formed a 10 month-long symmetrical triangle with the upper boundary acting as strong resistance at 20.90 levels. The upper boundary was tested several times over the course of the chart pattern. A daily close above 21.50 levels will confirm the breakout from the 10 month-long symmetrical triangle with the possible chart pattern price target of 26.80 levels. (Learn more: Video Tutorial)
ASIA
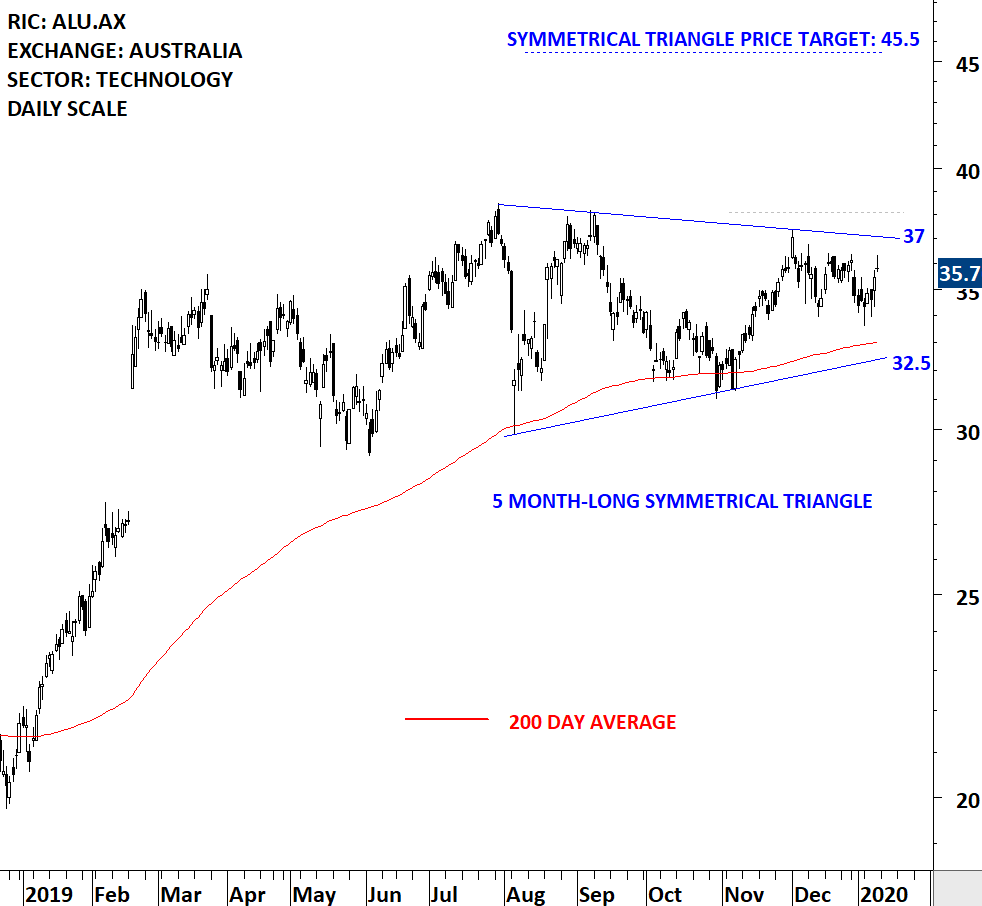
ALTIUM LTD (ALU.AX) – new addition to watchlist
Altium Limited is engaged in the development and sales of computer software for the design of electronic products. Its products include Altium Designer and TASKING. The stock is listed on the Australia Stock Exchange. Price chart formed a 5 month-long symmetrical triangle with the upper boundary acting as strong resistance at 37.00 levels. The upper boundary was tested several times over the course of the chart pattern. A daily close above 38.10 levels will confirm the breakout from the 5 month-long symmetrical triangle with the possible chart pattern price target of 45.50 levels. (Learn more: Video Tutorial)
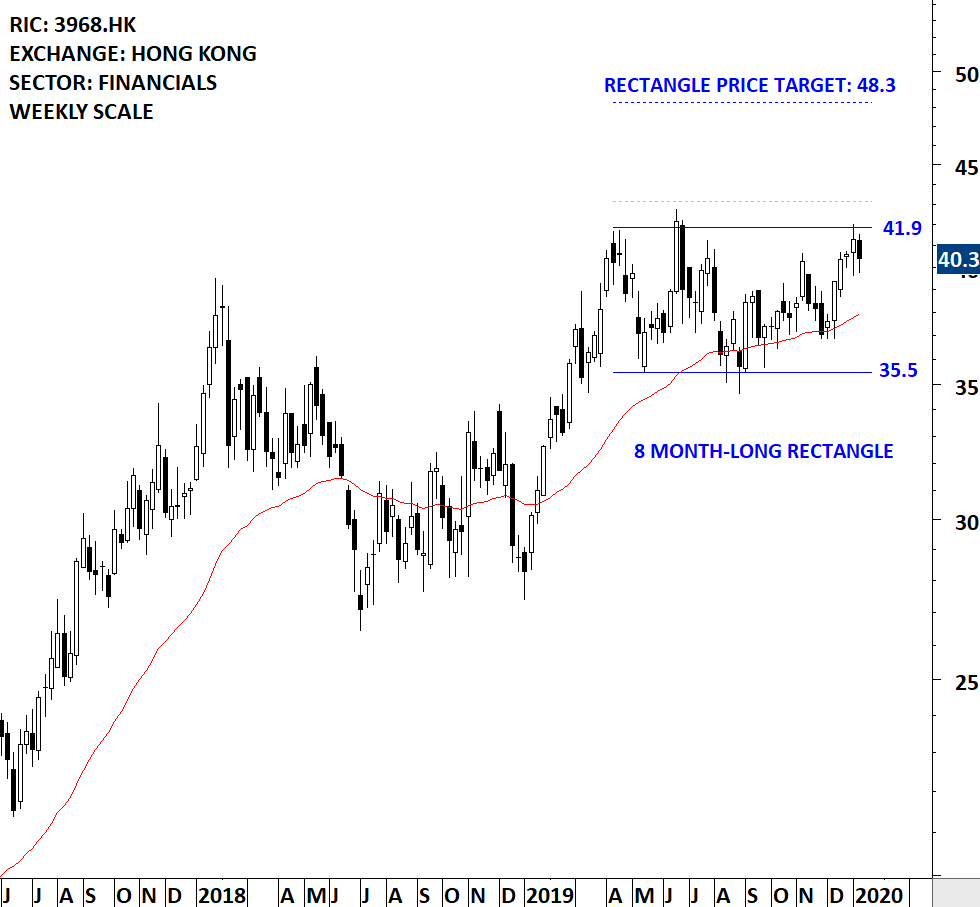
CHINA MERCHANTS BANK CO LTD (3968.HK) – new addition to watchlist
China Merchants Bank Co., Ltd. (the Bank) is a China-based commercial bank. The Bank operates its businesses through three segments, which are Wholesale Finance segment, Retail Finance segment and Other segment. The stock is listed on the Hong Kong Stock Exchange. Price chart formed an 8 month-long rectangle with the horizontal boundary acting as strong resistance at 41.9 levels. The horizontal boundary was tested several times over the course of the chart pattern. A daily close above 43.15 levels will confirm the breakout from the 8 month-long rectangle with the possible chart pattern price target of 48.3 levels. (Learn more: Video Tutorial)
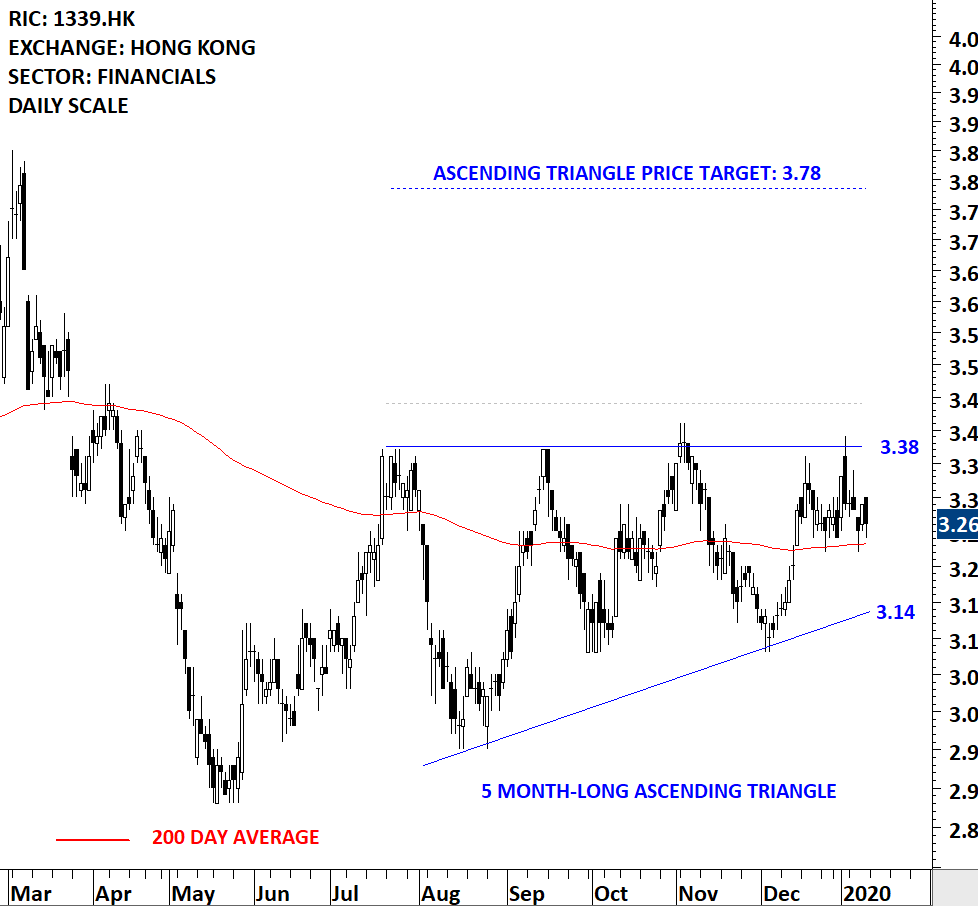
PEOPLE’S INSURANCE COMPANY GROUP OF CHINA LTD (1339.HK) – new addition to watchlist
The People’s Insurance Co. (Group) of China Ltd. is a holding company principally engaged in the provision of insurance products. Along with subsidiaries, the Company is mainly engaged in property insurance, health insurance, life insurance, reinsurance, Hong Kong insurance, pension insurance and operating insurance business. The stock is listed on the Hong Kong Stock Exchange. Price chart formed a 5 month-long ascending triangle with the horizontal boundary acting as strong resistance at 3.38 levels. The horizontal boundary was tested several times over the course of the chart pattern. A daily close above 3.44 levels will confirm the breakout from the 5 month-long ascending triangle with the possible chart pattern price target of 3.78 levels. (Learn more: Video Tutorial)
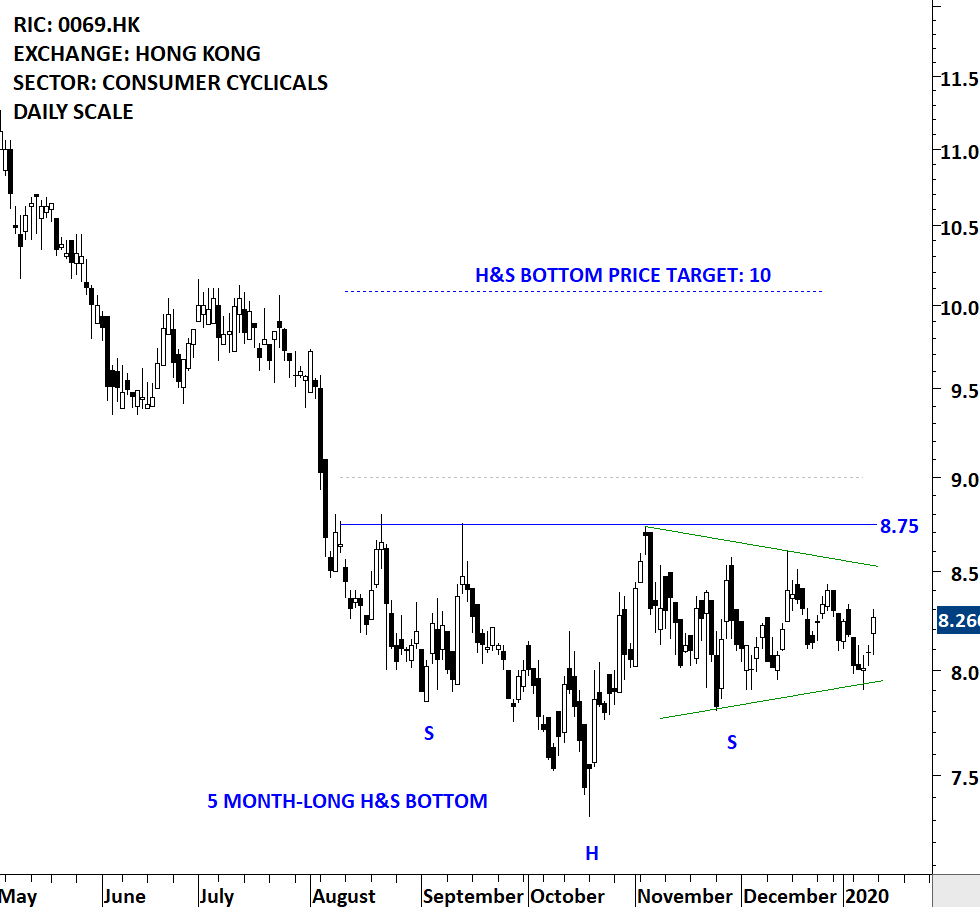
SHANGRI-LA ASIA LTD (0069.HK)
Shangri-La Asia Limited is a Hong Kong-based investment holding company principally engaged in hotel operation. The stock is listed on the Hong Kong Stock Exchange. Price chart formed a 5 month-long head and shoulder bottom with the horizontal boundary acting as strong resistance at 8.75 levels. The horizontal boundary was tested several times over the course of the chart pattern. A daily close above 9.0 levels will confirm the breakout from the 5 month-long head and shoulder bottom with the possible chart pattern price target of 10.0 levels. The right shoulder of the H&S bottom is possibly a symmetrical triangle. (Learn more: Video Tutorial)
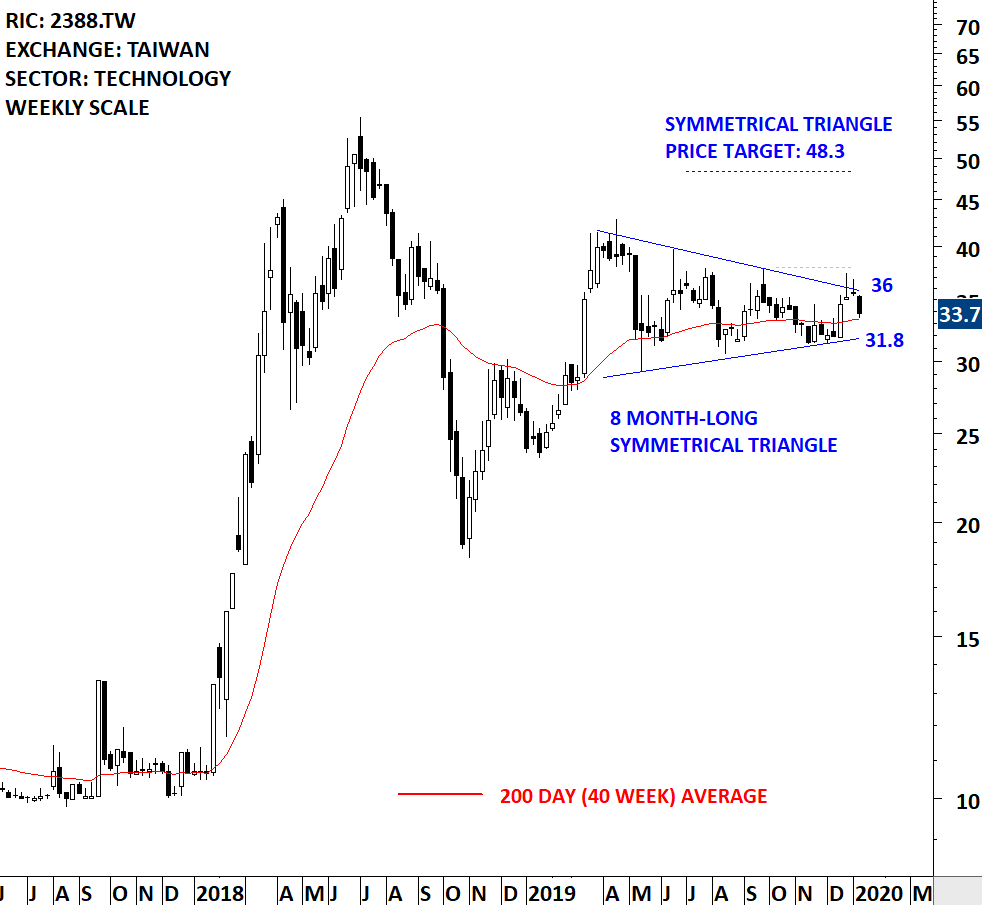
VIA TECHNOLOGIES INC (2388.TW)
VIA Technologies, Inc. is a Taiwan-based company principally engaged in the design, research, development, manufacture and distribution of chips. The stock is listed on the Taiwan Stock Exchange. Price chart formed a 8 month-long symmetrical triangle with the upper boundary acting as strong resistance at 36 levels. The upper boundary was tested several times over the course of the chart pattern. A daily close above 38 levels will confirm the breakout from the 8 month-long symmetrical triangle with the possible chart pattern price target of 48.30 levels. (Learn more: Video Tutorial)
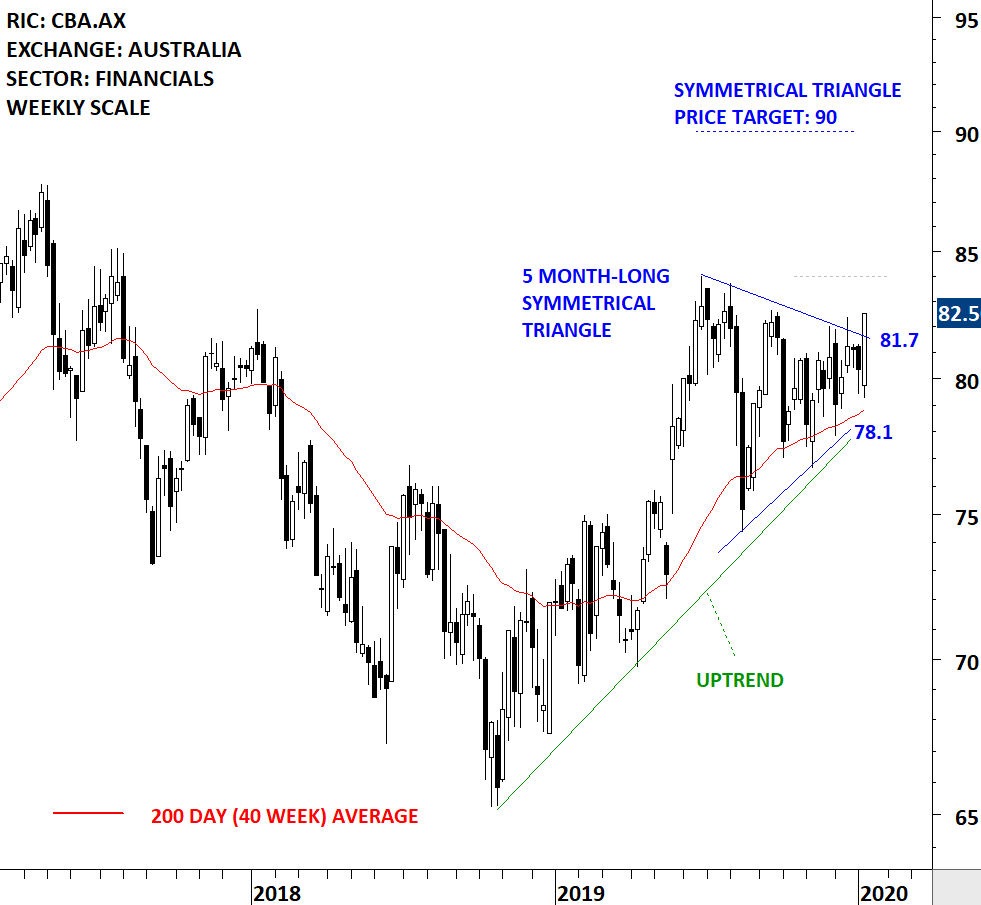
COMMONWEALTH BANK OF AUSTRALIA (CBA.AX)
Commonwealth Bank of Australia is a provider of financial services, including retail, business and institutional banking, funds management, superannuation, general insurance, broking services and finance company activities. The stock is listed on the Australia Stock Exchange. Price chart formed a 5 month-long symmetrical triangle with the upper boundary acting as strong resistance at 81.70 levels. The upper boundary was tested several times over the course of the chart pattern. A daily close above 84.00 levels will confirm the breakout from the 5 month-long symmetrical triangle with the possible chart pattern price target of 90.00 levels. (Learn more: Video Tutorial)
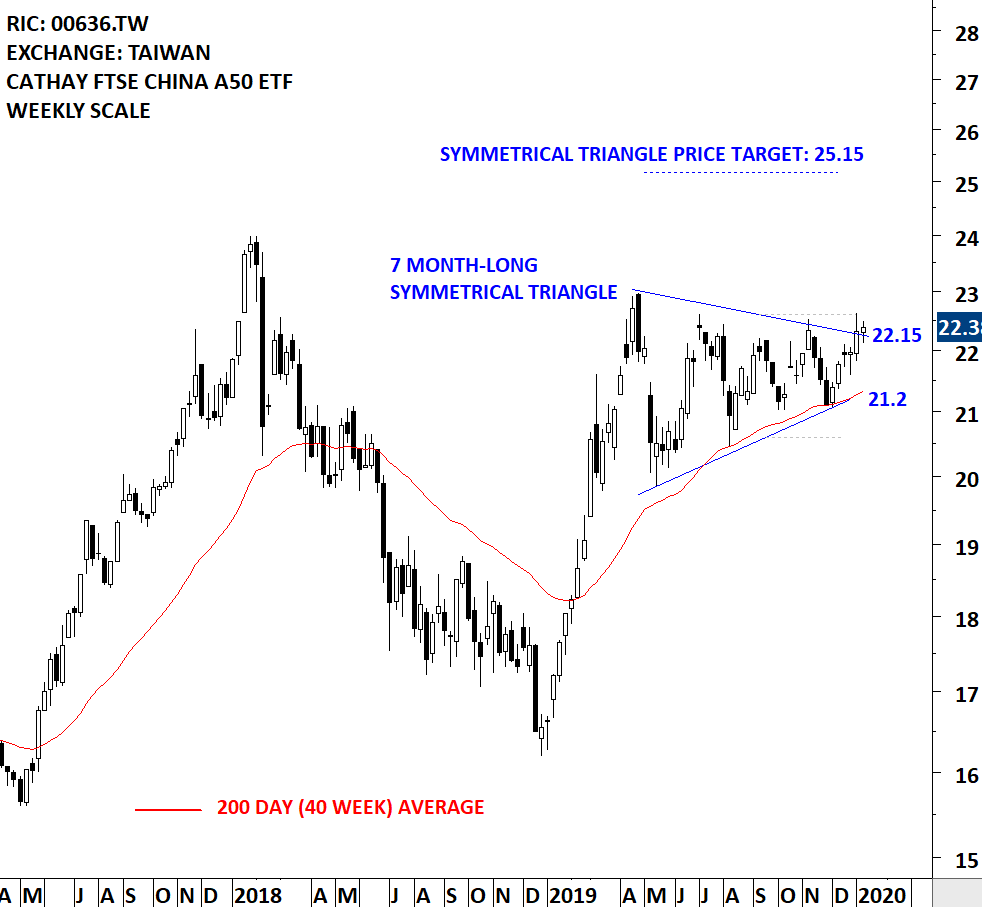
CATHAY FTSE CHINA A50 ETF (00636.TW)
The fund aims to diversify investment risk, ensure safety of fund asset and aims to track the performance of the FTSE China A50 Index. It mainly invests in the constituent stocks of the FTSE China A50 Index. The Fund invests in mainland China centralized securities listed and depository receipts of underwriting not less than 80% of the net assets. The ETF is listed on the Taiwan Stock Exchange. Price chart formed a 7 month-long symmetrical triangle with the upper boundary acting as strong resistance at 22.15 levels and the lower boundary as support at 21.2 levels. Both boundaries were tested several times over the course of the chart pattern. A daily close above 22.60 levels will confirm the symmetrical triangle as a bullish continuation with the possible chart pattern price target of 25.15 levels. (Learn more: Video Tutorial)
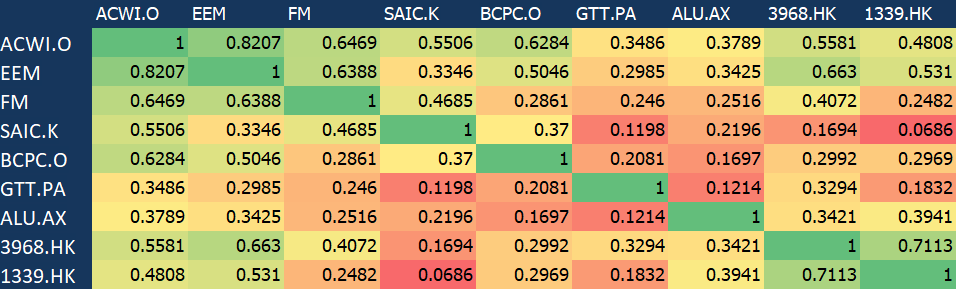
2 Year Weekly Correlation Matrix