SNC-LAVALIN GROUP INC (SNC.TO)
Every week Tech Charts Global Equity Markets report features some of the well-defined, mature classical chart patterns under a lengthy watchlist and the chart pattern breakout signals that took place during that week. Global Equity Markets report covers single stocks from developed and emerging markets, ETF’s and global equity indices. The report starts with a review section that highlights the important chart developments on global equity benchmarks. This blog post features a developing chart pattern on SNC-LAVALIN GROUP INC listed on the Toronto Stock Exchange.
SNC-LAVALIN GROUP INC (SNC.TO)
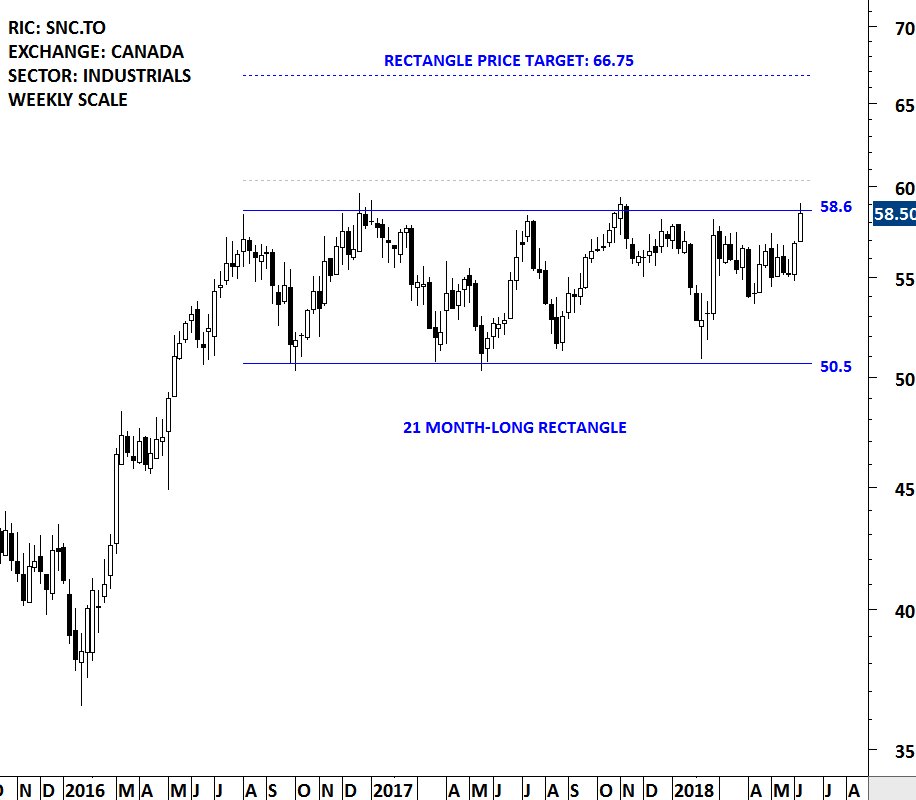
SNC-Lavalin Group Inc is a Canada-based engineering and construction company. The Company’s segments include Mining & Metallurgy, which provides solutions for a range of projects in the aluminum, gold, copper, iron ore, nickel, fertilizers and sulfur product sectors, among others; Oil & Gas, which includes projects in the upstream, midstream and downstream (supporting infrastructure) sectors for oil and gas and resources companies, supporting these clients operating across the asset lifecycle from front end evaluation through decommissioning (capital expenditures and operational expenditures); Power, which includes projects and services in hydro, nuclear and thermal power generation, renewable power generation, energy from waste, and electrical transmission and distribution systems; Infrastructure, which is divided into the Infrastructure & Construction and Operations & Maintenance sub-segments, and Capital segment is the investment and asset management arm of the Company. The stock is listed on the Toronto Stock Exchange. Price chart formed a well-defined multi-month long rectangle consolidation between 50.5 and 58.6. Price is testing the strong horizontal boundary at 58.6 levels. Breakouts after several tests of chart pattern boundary can result in a strong directional move. A daily close above 60.35 levels will confirm the breakout from the 21 month-long rectangle with the possible chart pattern price target of 66.75 levels.
Tech Charts Membership

By becoming a Premium Member, you’ll be able to improve your knowledge of the principles of classical charting.
With this knowledge, you can merge them with your investing system. In fact, some investors use my analyses to modify their existing style to invest more efficiently and successfully.

As a Premium Member of Aksel Kibar’s Tech Charts,
You will receive:
-
Global Equities Report. Delivered weekly.
-
Classical charting principles. Learn patterns and setups.
-
Actionable information. Worldwide indices and stocks of interest.
-
Risk management advice. The important trading points of each chart.
-
Information on breakout opportunities. Identify the ones you want to take action on.
-
Video tutorials. How patterns form and why they succeed or fail.
-
Watch list alerts. As they become available so you can act quickly.
-
Breakout alerts. Usually once a week.
-
Access to everything (now and as it becomes available)o Reports
o Videos and video series -
Multi-part webinar course. You learn the 8 most common charting principles.
-
Webinars. Actionable and timely advice on breaking out chart patterns.
For your convenience your membership auto renews each year.


