
SPAIN IBEX 35 INDEX
Every week Tech Charts Global Equity Markets report features some of the well-defined, mature classical chart patterns under a lengthy watchlist and the chart pattern breakout signals that took place during that week. Global Equity Markets report covers single stocks from developed and emerging markets, ETF’s and global equity indices. The report starts with a review section that highlights the important chart developments on global equity benchmarks. This blog post features one of several great chart analysis that were highlighted in the review section from the latest Global Equity Markets report.
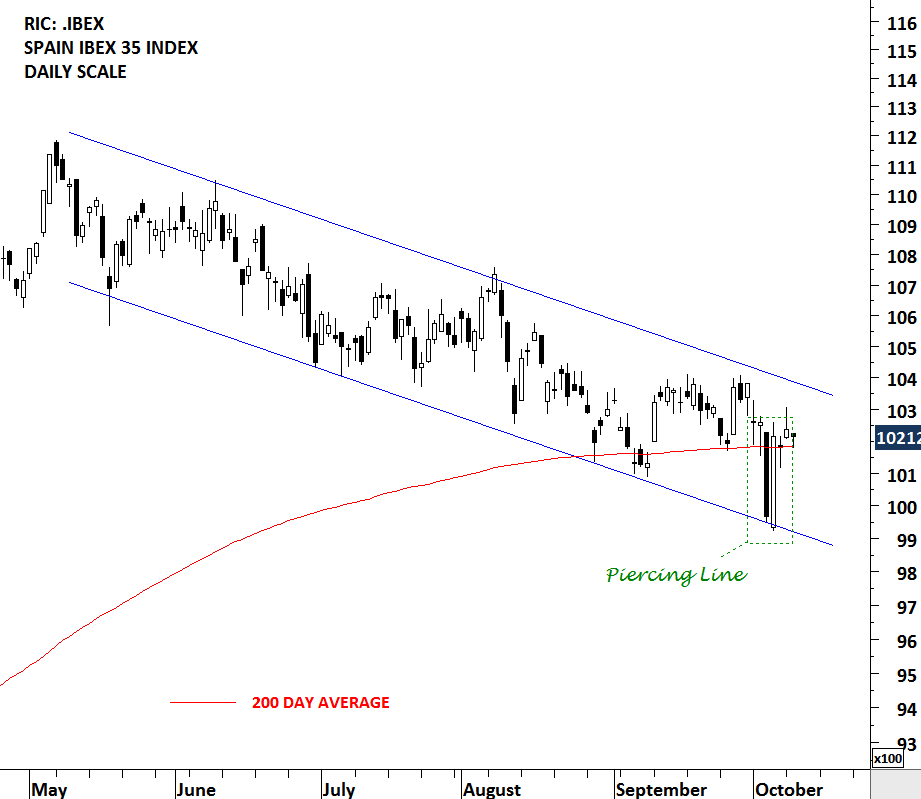
It has been a volatile week for Spanish politics and the country’s financial assets. Spain’s IBEX 35 index has been trending lower since May 2017. The downtrend in the short-term formed a well-defined trend channel. During last week’s sell-off, the index rebounded from the lower boundary of the trend channel. There is no classical chart pattern that would suggest that index is finding a bottom or another chart pattern development that would signal further downside. However, two interesting candlestick patterns drew my attention which I find worth mentioning.
At inflection points, markets give clues about the internal dynamics of the price action. These are better identified on candlestick charts. The weekly chart of the IBEX 35 index formed a hammer. This bullish reversal candlestick pattern becomes more important if it forms at important support areas. We can see 3 important technical levels overlapping at 10,000 levels. These are; the lower boundary of the 5 month-long downward sloping trend channel, the 200 day (40 week) moving average and the year-long upward trend line.
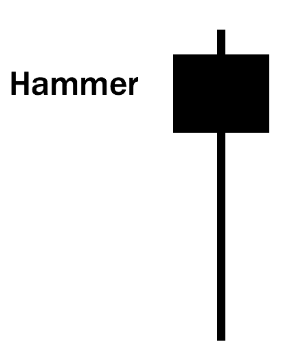
Hammer is a bullish reversal pattern that forms after a decline. In addition to a potential trend reversal, hammers can mark bottoms or support levels. After a decline, hammers signal a bullish revival. The low of the long lower shadow implies that sellers drove prices lower during the session. However, the strong finish indicates that buyers regained their footing to end the session on a strong note. While this may seem enough to act on, hammers require further bullish confirmation. Confirmation could come from a gap up or long white candlestick.
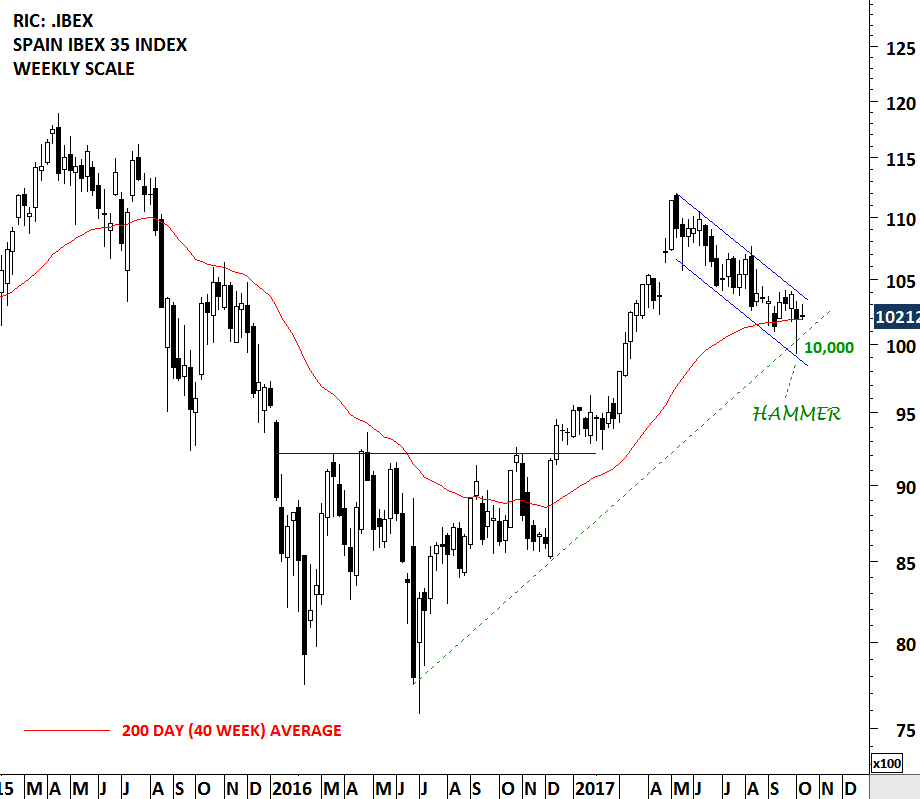
If we look at the daily price chart of Spain’s IBEX 35 index we can see the 5 month-long trend channel. Over the past 3 days, the index sold off to test the lower boundary of the trend channel and rebounded to recover the losses. On the daily chart, price formed a piercing line, another bullish reversal candlestick. While it is still early to call for a trend reversal, candlestick patters are suggesting a possible recovery. I will be watching the 10,000 critical support in the next few trading days. It is important for the index to hold above this support.
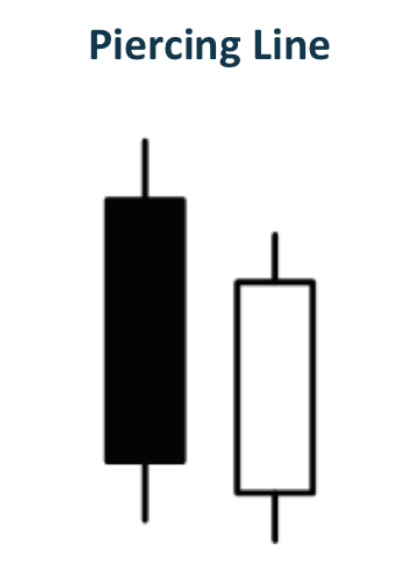 The Piercing Pattern is viewed as a bullish candlestick reversal pattern, similar to the Bullish Engulfing Pattern. A Piercing Pattern occurs when a bullish candle on Day 2 closes above the middle of Day 1’s bearish candle. Moreover, price gaps down on Day 2 only for the gap to be filled and closes significantly into the losses made previously in Day 1’s bearish candlestick. The rejection of the gap down by the bulls typically can be viewed as a bullish sign, and the fact that bulls were able to press further up into the losses of the previous day adds even more bullish sentiment.
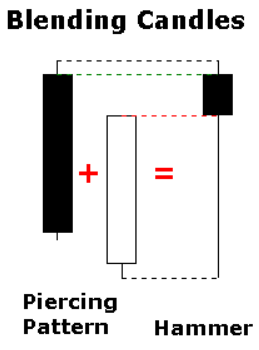 Candlestick patterns are made up of one or more candlesticks and can be blended together to form one candlestick. This blended candlestick captures the essence of the pattern and can be formed using the following: The open of the first candlestick, the close of the last candlestick and the high and low of the pattern. By using the open of the first candlestick, close of the second candlestick, and high/low of the pattern, a Piercing Pattern blends into a Hammer. The long lower shadow of the Hammer signals a potential bullish reversal.
Tech Charts Membership

By becoming a Premium Member, you’ll be able to improve your knowledge of the principles of classical charting.
With this knowledge, you can merge them with your investing system. In fact, some investors use my analyses to modify their existing style to invest more efficiently and successfully.

As a Premium Member of Aksel Kibar’s Tech Charts,
You will receive:
-
Global Equities Report. Delivered weekly.
-
Classical charting principles. Learn patterns and setups.
-
Actionable information. Worldwide indices and stocks of interest.
-
Risk management advice. The important trading points of each chart.
-
Information on breakout opportunities. Identify the ones you want to take action on.
-
Video tutorials. How patterns form and why they succeed or fail.
-
Watch list alerts. As they become available so you can act quickly.
-
Breakout alerts. Usually once a week.
-
Access to everything (now and as it becomes available)o Reports
o Videos and video series -
Multi-part webinar course. You learn the 8 most common charting principles.
-
Webinars. Actionable and timely advice on breaking out chart patterns.
For your convenience your membership auto renews each year.


