
MSCI ALL COUNTRIES WORLD INDEX ETF
Every week Tech Charts Global Equity Markets report features some of the well-defined, mature classical chart patterns (bullish & bearish) under a lengthy watchlist and the chart pattern breakout signals that took place during that week. Global Equity Markets report covers single stocks from developed and emerging markets, ETF’s and global equity indices. The main focus of the weekly report is to bring member’s attention some of the best examples of classical charting and chart patterns that are likely to resolve in a directional move. This blog post reviews one of several important technical developments in the Global Equity Markets.
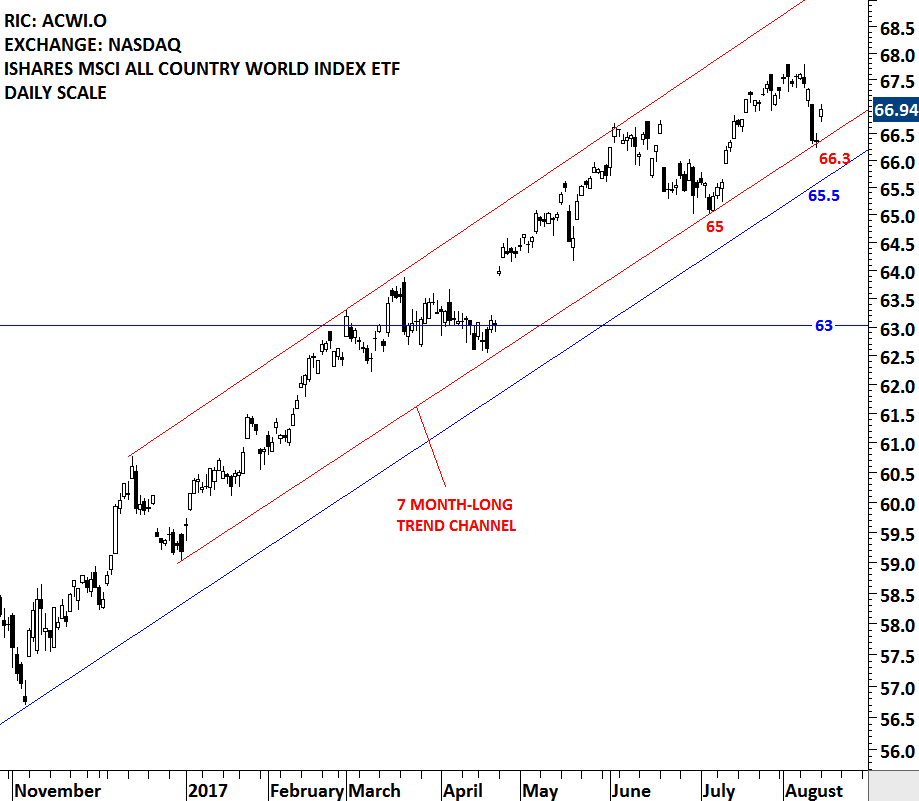
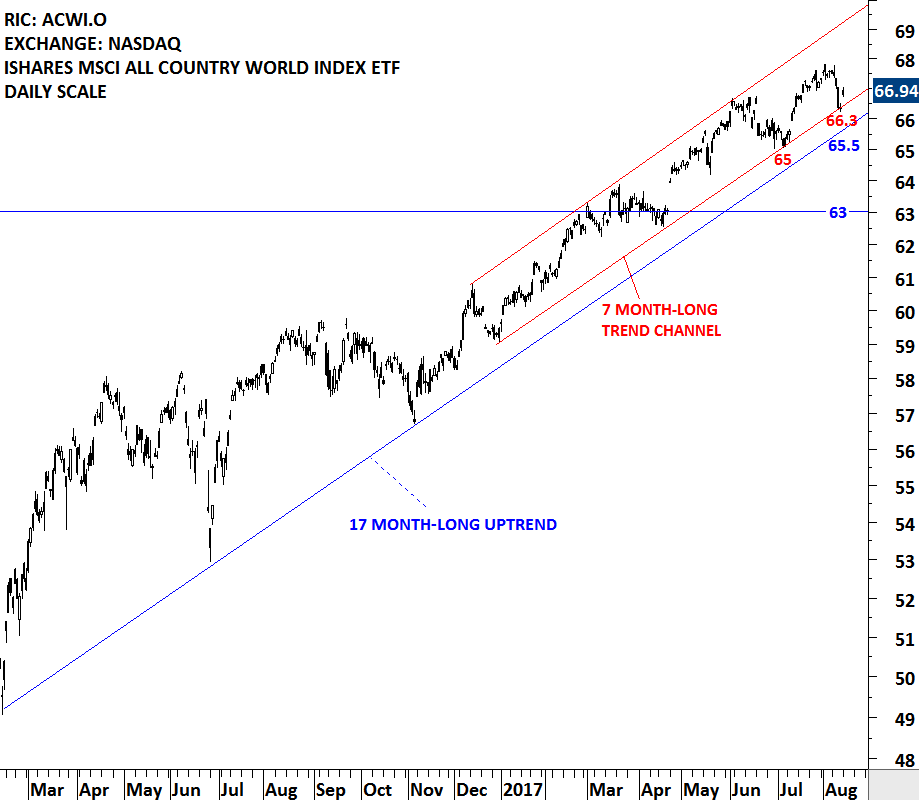
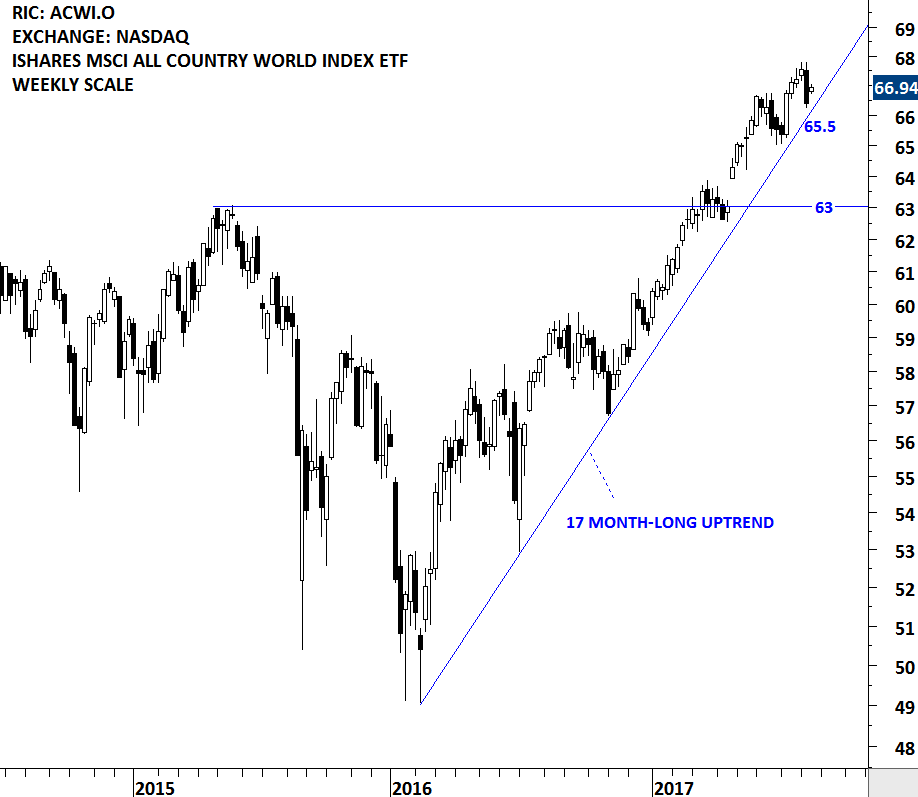
ISHARES MSCI ALL COUNTRY WORLD INDEX ETF (ACWI.O)
Last week’s price action did some technical damage on the charts. MSCI ALL COUNTRY WORLD INDEX ETF, a benchmark for global equity market performance gave back three weeks of gains in one weekly bar. The discussion on the financial networks and social media was about buying the dip. The iShares MSCI All Country World Index ETF is listed on the Nasdaq Stock Exchange. 66.3 is the lower boundary of the 7 month-long trend channel for the ACWI ETF. The index rebounded from the strong support once again. Failure to hold this support level can push the price to the next support at 65.5, which is the 17 month-long upward trendline. There is no clear chart pattern forming on the MSCI ACWI ETF that would suggest a top reversal. For those who are looking for a sell signal on the ACWI, the breakdown of the trend channels should give some guidance. In case of further weakness in the global equity markets ( i.e. a breakdown on the ACWI), the weekly Global Equity Markets report featured some of the well-defined bearish chart setups in the global equities and ETFs.
Tech Charts Membership

By becoming a Premium Member, you’ll be able to improve your knowledge of the principles of classical charting.
With this knowledge, you can merge them with your investing system. In fact, some investors use my analyses to modify their existing style to invest more efficiently and successfully.

As a Premium Member of Aksel Kibar’s Tech Charts,
You will receive:
-
Global Equities Report. Delivered weekly.
-
Classical charting principles. Learn patterns and setups.
-
Actionable information. Worldwide indices and stocks of interest.
-
Risk management advice. The important trading points of each chart.
-
Information on breakout opportunities. Identify the ones you want to take action on.
-
Video tutorials. How patterns form and why they succeed or fail.
-
Watch list alerts. As they become available so you can act quickly.
-
Breakout alerts. Usually once a week.
-
Access to everything (now and as it becomes available)o Reports
o Videos and video series -
Multi-part webinar course. You learn the 8 most common charting principles.
-
Webinars. Actionable and timely advice on breaking out chart patterns.
For your convenience your membership auto renews each year.


