We had our member webinar on Thursday Dec 3rd. If you couldn’t attend the live webinar, a recording will be available in the next few days. All members webinars and educational videos are posted under the page Educational Videos. Once it is uploaded to the page we will send an e-mail notification. Please feel free to ask any questions by e-mailing aksel@techcharts.net
REVIEW
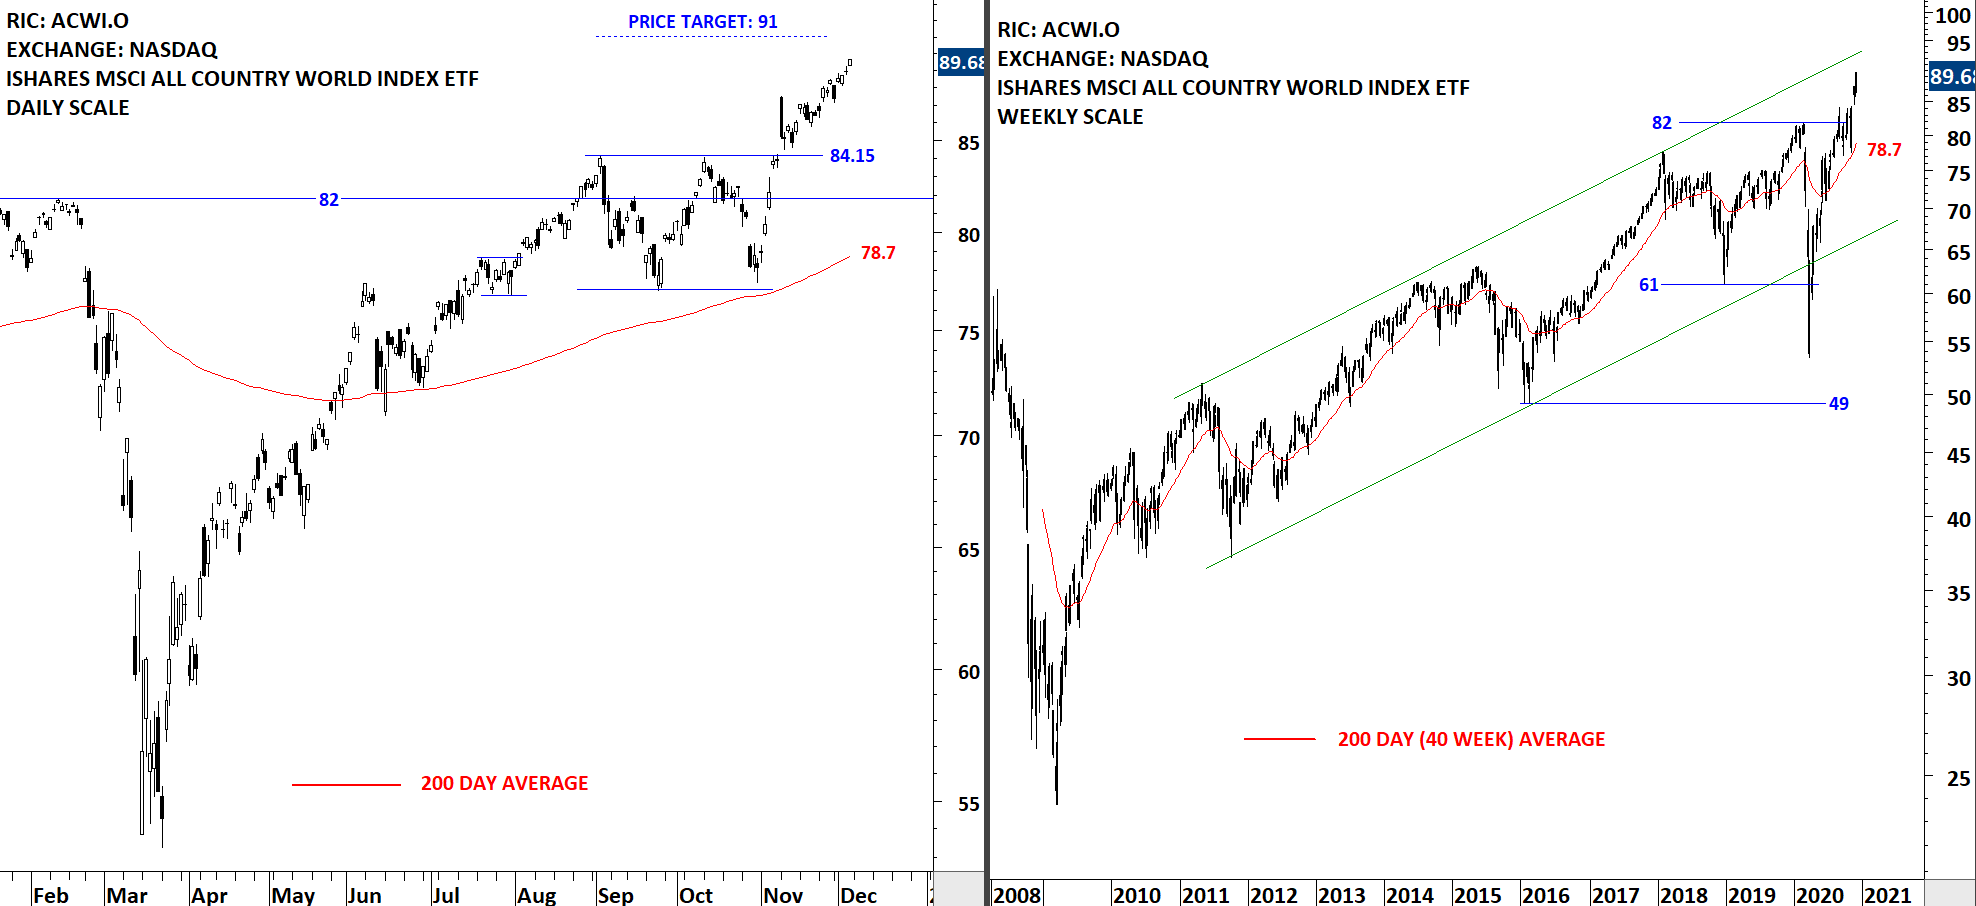
The benchmark for the Global equity markets performance, the iShares MSCI All Country World Index ETF (ACWI.O) resumed its uptrend after completing a rectangle chart pattern. Breakout took place above 84.15, the upper boundary of the rectangle which is now a short-term support. Possible chart pattern price target stands at 91 levels. During any pullback 84.15 will act as support. The 200-day moving average, which I utilize as a trend filter, is rising as well, now at 78.7 levels.
Every week Tech Charts Global Equity Markets report features some of the well-defined, mature classical chart patterns under a lengthy watchlist and the chart pattern breakout signals that took place during that week. Global Equity Markets report covers single stocks from developed, emerging and frontier markets, ETF’s and global equity indices. The report starts with a review section that highlights the important chart developments on global equity benchmarks. This blog post features from the watchlist section Ekinops SA listed on the Paris Stock Exchange.
EKINOPS SA (EKI.PA)
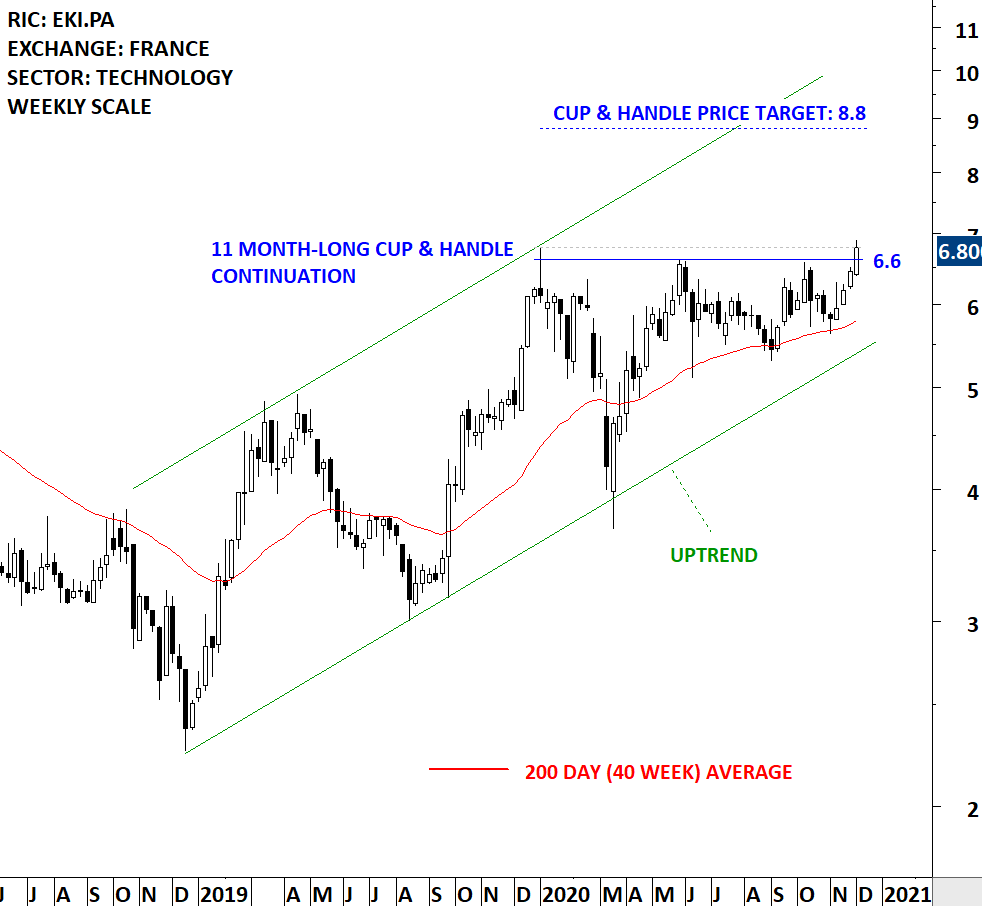
Ekinops SA is a France-based company engaged in the provision of optical transport solutions for service providers and private networks. The Company develops optical aggregation and transportation sub-systems for metropolitan and long-distance networks. The stock is listed on the Paris Stock Exchange. Price chart formed an 11 month-long cup & handle continuation with the horizontal boundary acting as strong resistance at 6.60 levels. The horizontal boundary was tested several times over the course of the chart pattern. A daily close above 6.80 levels will confirm the breakout from the 11 month-long cup & handle continuation with the possible chart pattern price target of 8.8 levels. (Data as of 30/11/2020)
A short educational video on Cup & handle continuation chart pattern
Tech Charts Membership
By becoming a Premium Member, you’ll be able to improve your knowledge of the principles of classical charting.
With this knowledge, you can merge them with your investing system. In fact, some investors use my analyses to modify their existing style to invest more efficiently and successfully.
We are continuing our Member webinar series with several important and frequently asked topics. In the following webinar, we will follow a similar approach as the last webinar. Given that the topics are different concepts in technical analysis/classical charting and trading, each section will have a +/- 10 min presentation followed by a Q&A on that section.
Scheduled for: Thursday, December 3rd, 8:30 am mountain (register below)
Webinar Outline
Review of chart pattern statistics and discussion on chart pattern reliability
Current market conditions and review of major benchmarks/important chart pattern developments
A frequently asked chart pattern, H&S continuation and review of H&S failures and how to trade them
A typical day for me, the daily routine, selection of markets, review and research tips.
We are continuing our Member webinar series with several important and frequently asked topics. In the following webinar, we will follow a similar approach as the last webinar. Given that the topics are different concepts in technical analysis/classical charting and trading, each section will have a +/- 10 min presentation followed by a Q&A on that section.
Scheduled for: Thursday, December 3rd, 8:30 am mountain (register below)
https://blog.techcharts.net/wp-content/uploads/2017/12/Tech-Charts-Webinar-.jpg427640Aksel Kibarhttps://blog.techcharts.net/wp-content/uploads/2017/05/Tech-Charts-logo-FINAL-CLEAN-340w.pngAksel Kibar2020-11-28 07:00:382020-11-29 20:13:12Live Webinar and Q&A with Aksel – Thursday, December 3rd, 8:30 am mountain
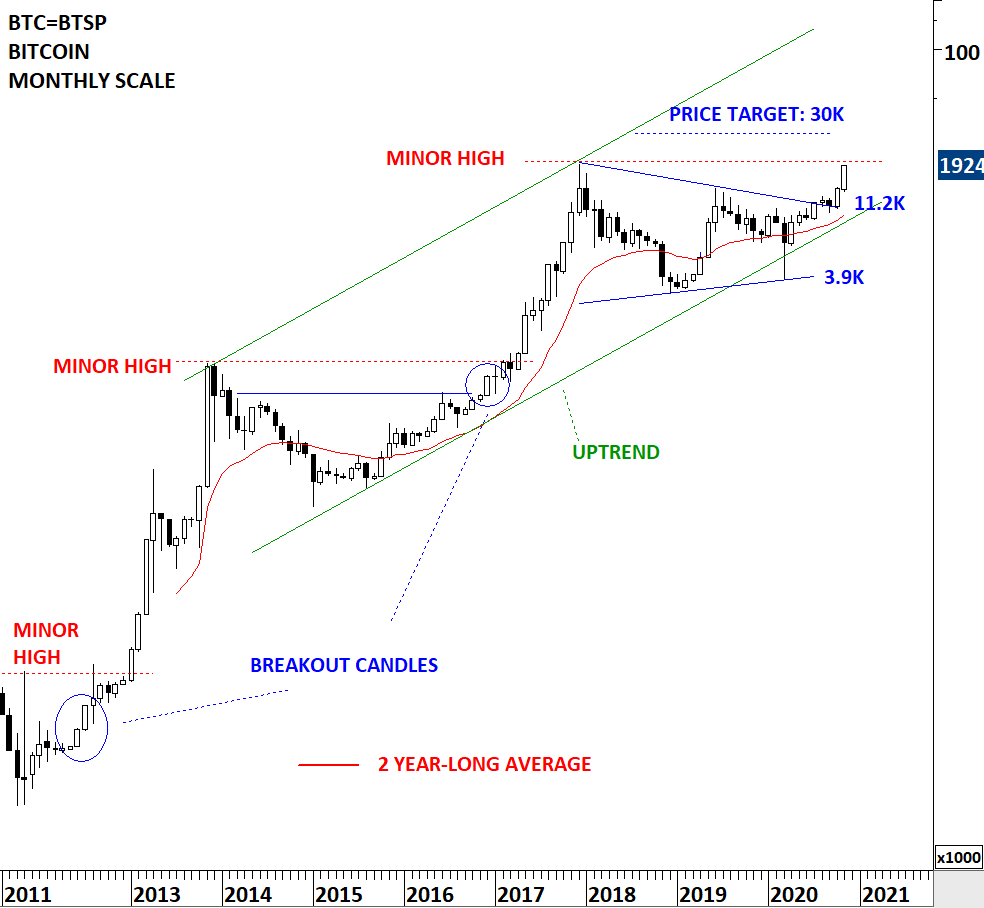
Every week Tech Charts Global Equity Markets report features some of the well-defined, mature classical chart patterns under a lengthy watchlist and the chart pattern breakout signals that took place during that week. Global Equity Markets report covers single stocks from developed, emerging and frontier markets, ETF’s and global equity indices. The report starts with a review section that highlights the important chart developments on global equity benchmarks, commodities, currencies and cryptocurrencies that might be in focus. This blog post features from the review section BTCUSD. Please note that this is a monthly scale price chart and the November price action (last candle) is still not completed. I’m featuring this chart to show the levels BTC is testing and to draw attention to a possible outcome with symmetrical triangle breakouts.
BTCUSD possibly completed a symmetrical triangle chart pattern on the long-term price chart. Symmetrical triangle is a chart pattern with diagonal boundaries. One difficulty with trading breakouts from diagonal boundaries is the fact that price, following the breakout can find resistance at the minor high. Whereas breakouts from chart patterns with horizontal boundaries usually clear all minor highs at the same time of the breakout.
The minor high for BTC stands at 19,666 levels. Question is, will BTC find resistance at the minor high before breaking out to all-time highs. Previous two breakouts took place after price found resistance and retraced from the minor highs. Chart pattern price target for BTC stands at 30K and with possibly a potential to move much higher, but now we need to focus on the price action around 19,666 levels.
Here is a short educational video that explains the importance of the minor high as resistance with symmetrical triangle breakouts.
Tech Charts Membership
By becoming a Premium Member, you’ll be able to improve your knowledge of the principles of classical charting.
With this knowledge, you can merge them with your investing system. In fact, some investors use my analyses to modify their existing style to invest more efficiently and successfully.
The benchmark for the Global equity markets performance, the iShares MSCI All Country World Index ETF (ACWI.O) held on to its gains after completing a possible rectangle chart pattern. Breakout took place above 84.15, the upper boundary of the rectangle which is now a short-term support. Possible chart pattern price target stands at 91 levels. During any pullback 84.15 will act as support.
Every week Tech Charts Global Equity Markets report features some of the well-defined, mature classical chart patterns under a lengthy watchlist and the chart pattern breakout signals that took place during that week. Global Equity Markets report covers single stocks from developed, emerging and frontier markets, ETF’s and global equity indices. The report starts with a review section that highlights the important chart developments on global equity benchmarks. This blog post features from the watchlist section Marathon Gold Corp (Marathon) listed on the Toronto Stock Exchange.
With breakouts I like to confirm couple of things on price charts. When those conditions are met, I have higher conviction on the trade setup. Those are:
A well-defined chart pattern with horizontal boundaries
Several tests of chart pattern boundary before a breakout takes place
If the chart pattern is a bullish setup, possibility of breakout taking place above the 200-day average (trend filter)
Possibility of a breakout to all-time highs (path of least resistance)
Below chart is meeting all the above criteria and as a result it is a high conviction trade setup for me.
MARATHON GOLD CORP (MOZ.TO)
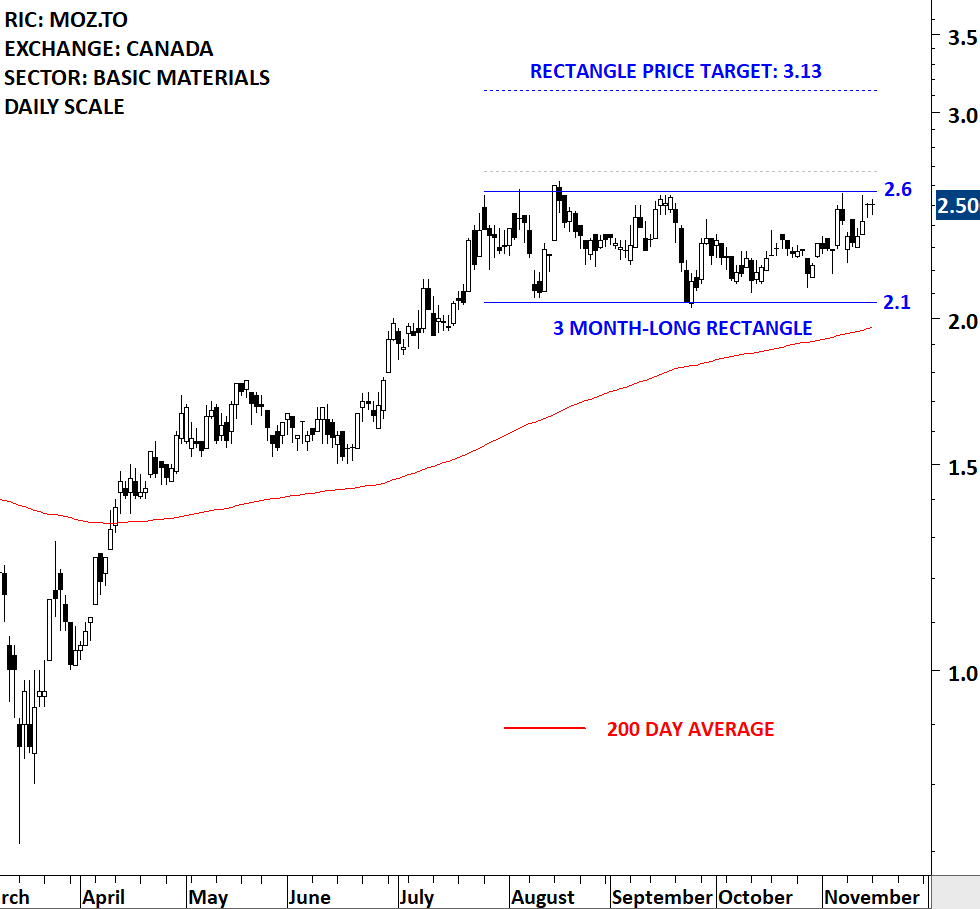
Marathon Gold Corp (Marathon) is a Canada-based company engaged in the acquisition, exploration and development of natural resource properties located in North America. The stock is listed on the Toronto Stock Exchange. Price chart formed a 3 month-long rectangle with the horizontal boundary acting as strong resistance at 2.60 levels. The horizontal boundary was tested several times over the course of the chart pattern. A daily close above 2.67 levels will confirm the breakout from the 3 month-long rectangle with the possible chart pattern price target of 3.13 levels.
Tech Charts Membership
By becoming a Premium Member, you’ll be able to improve your knowledge of the principles of classical charting.
With this knowledge, you can merge them with your investing system. In fact, some investors use my analyses to modify their existing style to invest more efficiently and successfully.
The benchmark for the Global equity markets performance, the iShares MSCI All Country World Index ETF (ACWI.O) completed the short-term consolidation, possibly a bullish rectangle, on the upside . Breakout took place with a gap opening. Following the breakout the price pulled back to the support at 84.15 levels and rebounded. Price objective for the rectangle stands at 91 levels. During any pullback 84.15 will act as support.
Every week Tech Charts Global Equity Markets report features some of the well-defined, mature classical chart patterns under a lengthy watchlist and the chart pattern breakout signals that took place during that week. Global Equity Markets report covers single stocks from developed, emerging and frontier markets, ETF’s and global equity indices. The report starts with a review section that highlights the important chart developments on global equity benchmarks. This blog post features from the watchlist section the iShares S&P MID CAP 400 VALUE ETF (IJJ) listed on the New York Stock Exchange.
ISHARES S&P MID CAP 400 VALUE ETF (IJJ)
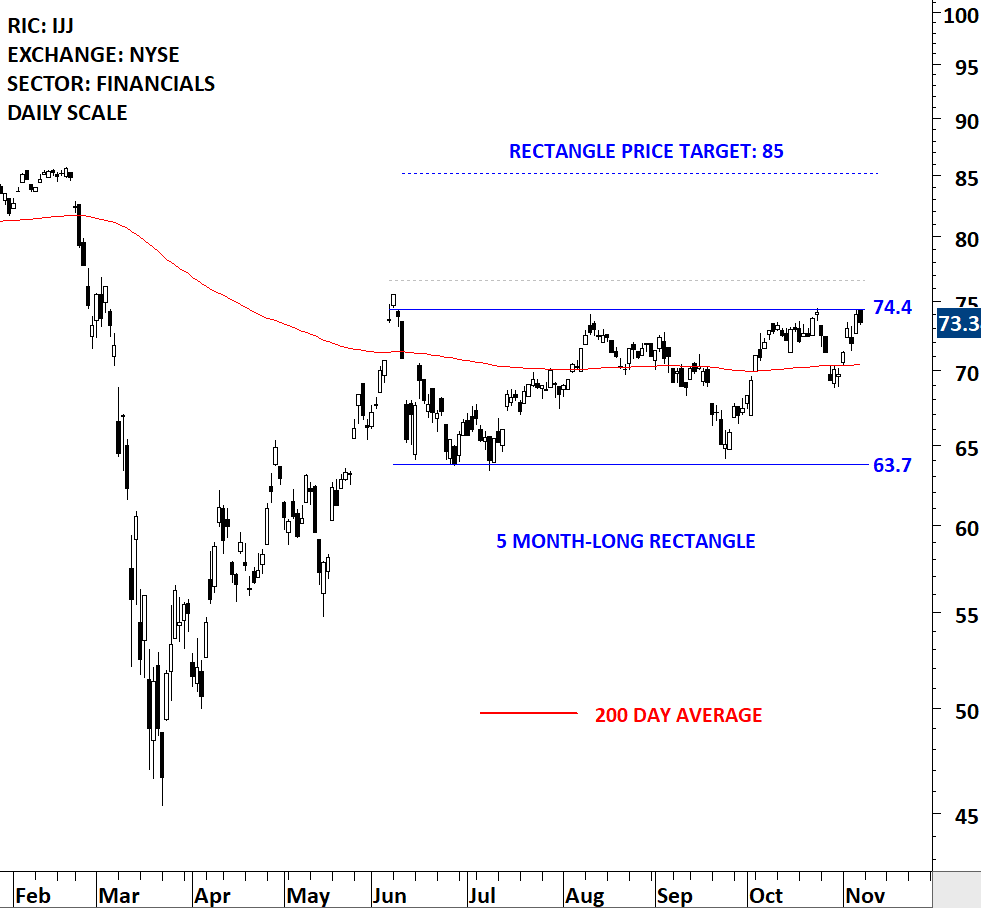
The Fund seeks investment results that correspond generally to the price and yield performance, before fees and expenses, of the S&P MidCap 400/BARRA Value Index. The Index consists of stocks from a broad range of industries. Uses a replication strategy to track the Index. The ETF is listed on the New York Stock Exchange. Price chart formed a 5 month-long rectangle with the horizontal boundary acting as strong resistance at 74.40 levels. The horizontal boundary was tested several times over the course of the chart pattern. A daily close above 76.60 levels will confirm the breakout from the 5 month-long rectangle with the possible chart pattern price target of 85.0 levels.
Tech Charts Membership
By becoming a Premium Member, you’ll be able to improve your knowledge of the principles of classical charting.
With this knowledge, you can merge them with your investing system. In fact, some investors use my analyses to modify their existing style to invest more efficiently and successfully.
The benchmark for the Global equity markets performance, the iShares MSCI All Country World Index ETF (ACWI.O) rebounded from strong support area formed by the minor low and the 200-day average. The ETF is now testing previous highs at 84.15 levels that is acting as resistance. I’m weighing the possibility of the last 2 month’s consolidation acting as a bullish continuation chart pattern. While a breakout might not take place immediately, a breach and a daily close above 84.15 will suggest higher levels, possibly a chart pattern price objective at 91 levels. Until a breakout takes place, the ETF can remain range-bound between 77 and 84.15 levels.