
A HEALTHY NEW YEAR
You don’t have access to view this content.

You don’t have access to view this content.
We always include in our wishes “health” but sometimes we take it for granted. 2020 has been one of those years that we have realized that nothing should be taken for granted. I hope you and your families have been safe & healthy during these difficult times. I wish everyone a HEALTHY new year with great success and accomplishments. I’m thankful to all of you for your feedback and support that helps me to improve the service here at Tech Charts. I will continue to be of your assistance.
Kind regards,
Aksel Kibar, CMT
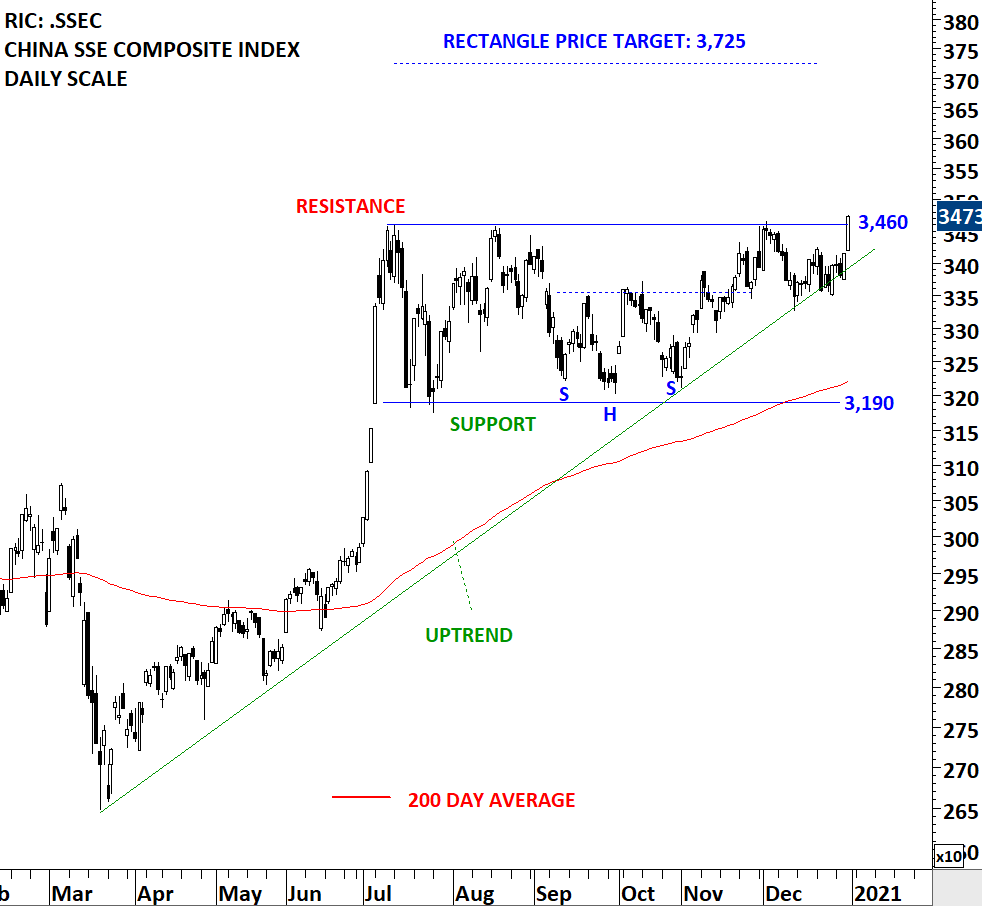
I’ve been covering several Global equity benchmarks in the Global Equity Markets report. One of those extremely bullish setups is taking place in China SSE Composite Index and also the other sub-indices in China. 2021 can start with a positive note for China equities and as a result for Emerging Markets.
The chart below shows the China SSE Composite Index (larger universe for China equities). The index possibly formed a well-defined rectangle chart pattern with the upper boundary acting as resistance at 3,460 levels. Breakout can push the index towards the price objective at 3,725 levels. This week’s price action once again tested the upper boundary of the well-defined rectangle. Strong price action can be analyzed as positive and possibly a preparation for a breakout higher.

By becoming a Premium Member, you’ll be able to improve your knowledge of the principles of classical charting.
With this knowledge, you can merge them with your investing system. In fact, some investors use my analyses to modify their existing style to invest more efficiently and successfully.
You will receive:
For your convenience your membership auto renews each year.

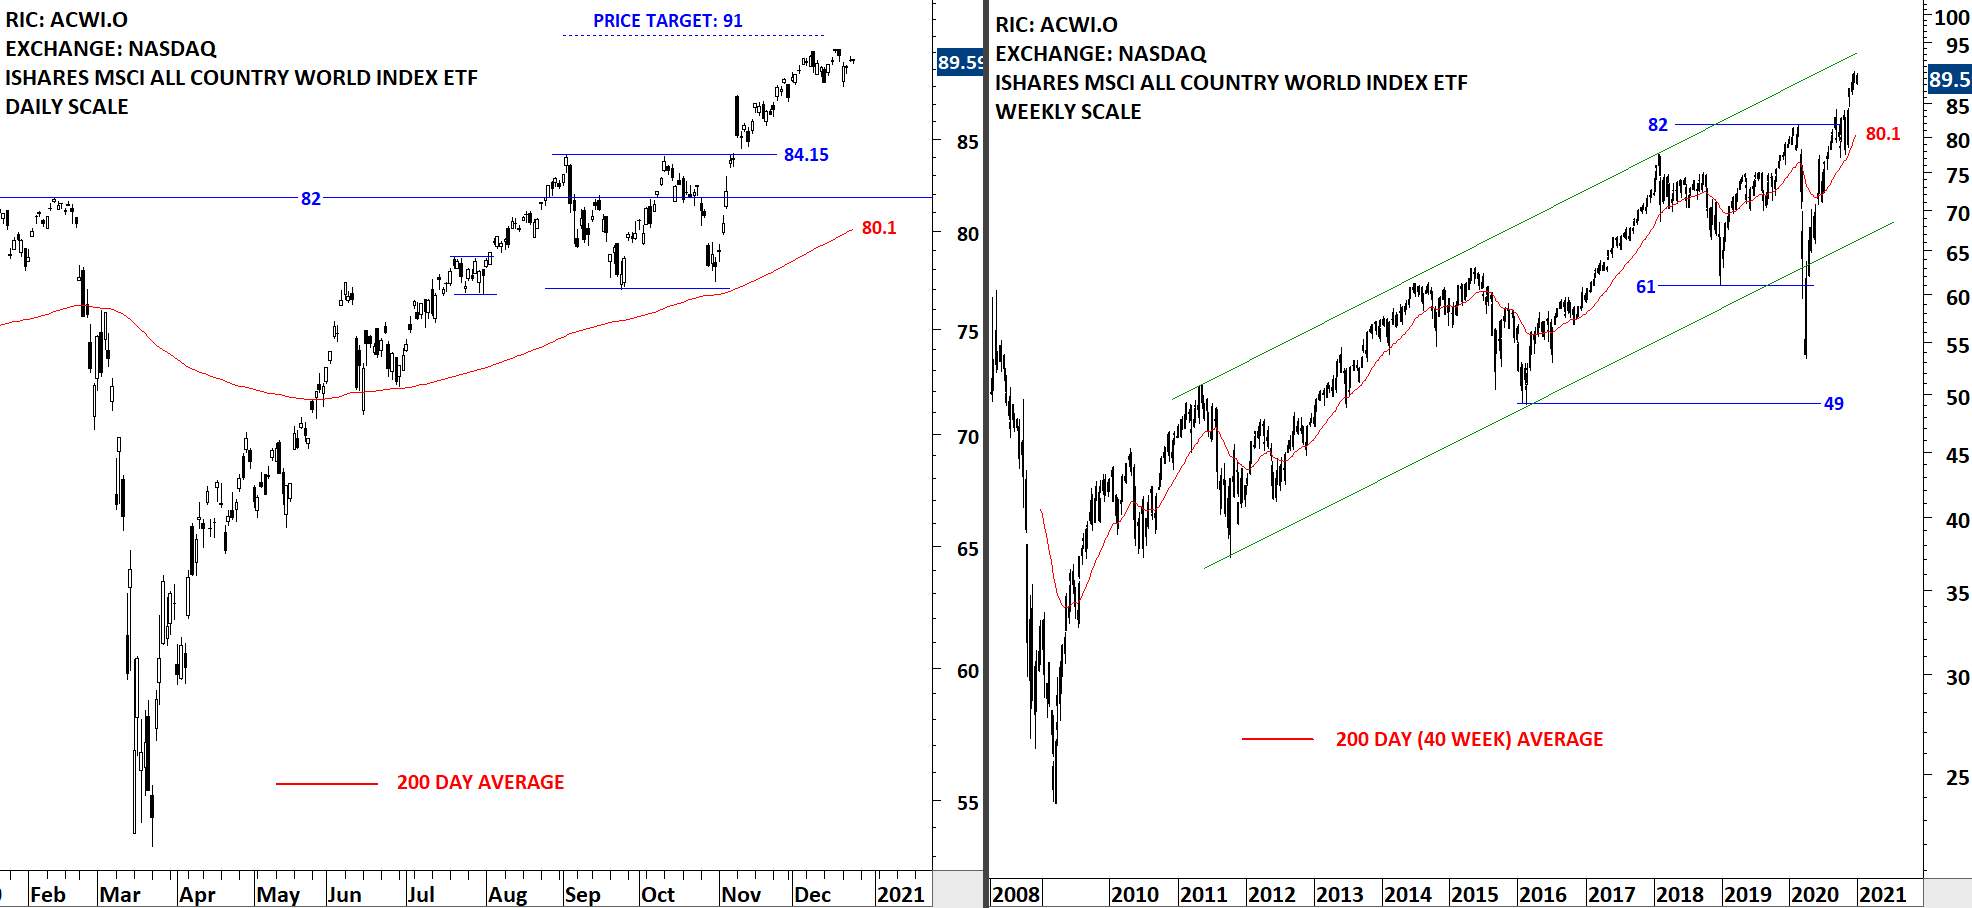
The benchmark for the Global equity markets performance, the iShares MSCI All Country World Index ETF (ACWI.O) continues to remain in an uptrend after completing a rectangle chart pattern. Possible chart pattern price target stands at 91 levels. On the weekly scale price chart the ETF is also close to the upper boundary of the long-term uptrend channel. During any pullback 84.15 will act as support. The 200-day moving average, which I utilize as a trend filter, is rising as well, now at 80.1 levels.

Every week Tech Charts Global Equity Markets report features some of the well-defined, mature classical chart patterns under a lengthy watchlist and the chart pattern breakout signals that took place during that week. Global Equity Markets report covers single stocks from developed, emerging and frontier markets, ETF’s and global equity indices. The report starts with a review section that highlights the important chart developments on global equity benchmarks. This blog post features from the watchlist section Dassault Systemes listed on the Paris Stock Exchange.
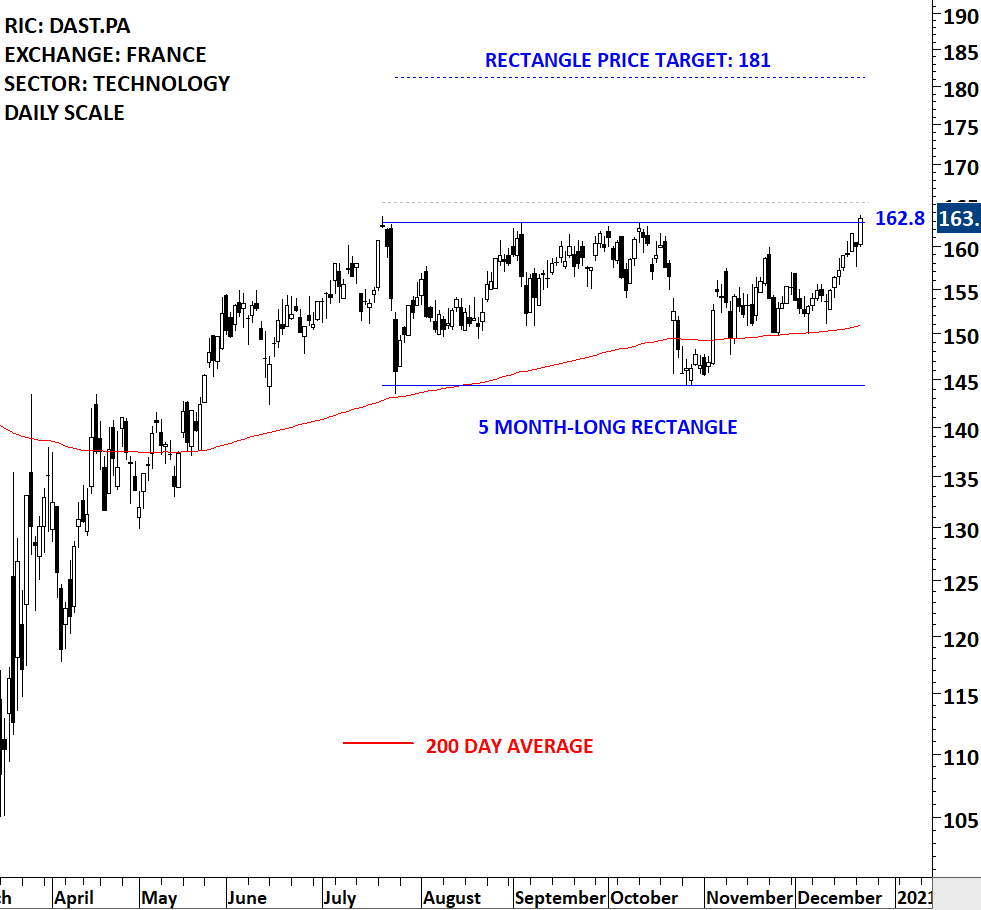
Dassault Systemes SE is a France-based software company, which provides different kind of three-dimensional (3D) solutions. The stock is listed on the Paris Stock Exchange. Price chart formed a 5 month-long rectangle with the horizontal boundary acting as strong resistance at 162.80 levels. The horizontal boundary was tested several times over the course of the chart pattern. A daily close above 165.30 levels will confirm the breakout from the 5 month-long rectangle with the possible chart pattern price target of 181.0 levels. Breakout can push the stock to all-time highs. (Data as of 23/12/2020)
By becoming a Premium Member, you’ll be able to improve your knowledge of the principles of classical charting.
With this knowledge, you can merge them with your investing system. In fact, some investors use my analyses to modify their existing style to invest more efficiently and successfully.
You will receive:
For your convenience your membership auto renews each year.

The benchmark for the Global equity markets performance, the iShares MSCI All Country World Index ETF (ACWI.O) resumed its uptrend after completing a rectangle chart pattern. Possible chart pattern price target stands at 91 levels. This week’s price action came close to the price objective. On the weekly scale price chart the ETF is also close to the upper boundary of the long-term uptrend channel. During any pullback 84.15 will act as support. The 200-day moving average, which I utilize as a trend filter, is rising as well, now at 79.7 levels.


Every week Tech Charts Global Equity Markets report features some of the well-defined, mature classical chart patterns under a lengthy watchlist and the chart pattern breakout signals that took place during that week. Global Equity Markets report covers single stocks from developed, emerging and frontier markets, ETF’s and global equity indices. The report starts with a review section that highlights the important chart developments on global equity benchmarks. This blog post features from the watchlist section The ISHARES US HOME CONSTRUCTION ETF listed on the New York Stock Exchange. The ETF might be forming a H&S top failure. Below you will also find a short educational video on how H&S top failure can develop, trigger a fresh buy signal and how to measure price objective.
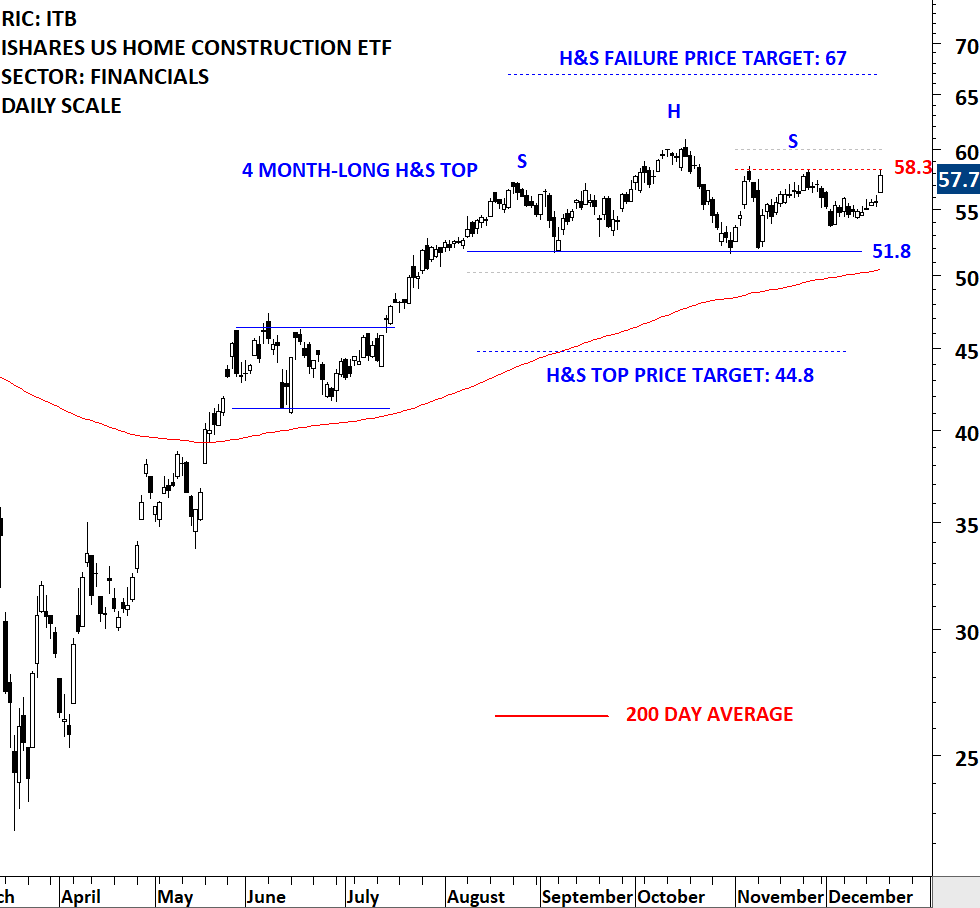
The ISHARES US HOME CONSTRUCTION ETF seeks to track the investment results of the Dow Jones US Select Home Construction Index composed of US equities in the home construction sector. The Fund generally invests at least 90% of its assets in securities of the Underlying Index and in depositary receipts representing securities of the Index. The ETF is listed on the New York Stock Exchange. Price chart formed a 4 month-long head and shoulder top with the horizontal boundary acting as strong support at 51.80 levels. The horizontal boundary was tested several times over the course of the chart pattern. A daily close below 50.25 levels will confirm the breakdown from the 4 month-long head and shoulder top with the possible chart pattern price target of 44.8 levels. I’m also monitoring this chart for a possible H&S top failure. A breach above the high of the right shoulder will negate the H&S top chart pattern. A daily close above 60 levels (3% above the high of right shoulder) can be used as a breakout confirmation to trade the chart pattern from the long side. Price objective for the H&S top failure stands at 67 levels. (Data as of 17/12/2020)
By becoming a Premium Member, you’ll be able to improve your knowledge of the principles of classical charting.
With this knowledge, you can merge them with your investing system. In fact, some investors use my analyses to modify their existing style to invest more efficiently and successfully.
You will receive:
For your convenience your membership auto renews each year.

I start my research on Mondays and finalize by end of day Thursday. Friday is dedicated to putting all ideas to the report format. During the week I come across good setups and those are featured in the weekly report. However, there are those that pop during the week and is worth bringing to your attention before the week finalizes. Below are latest additions to Tech Charts watchlist in case they experience breakouts during the week. These charts will also be included in the weekly update.

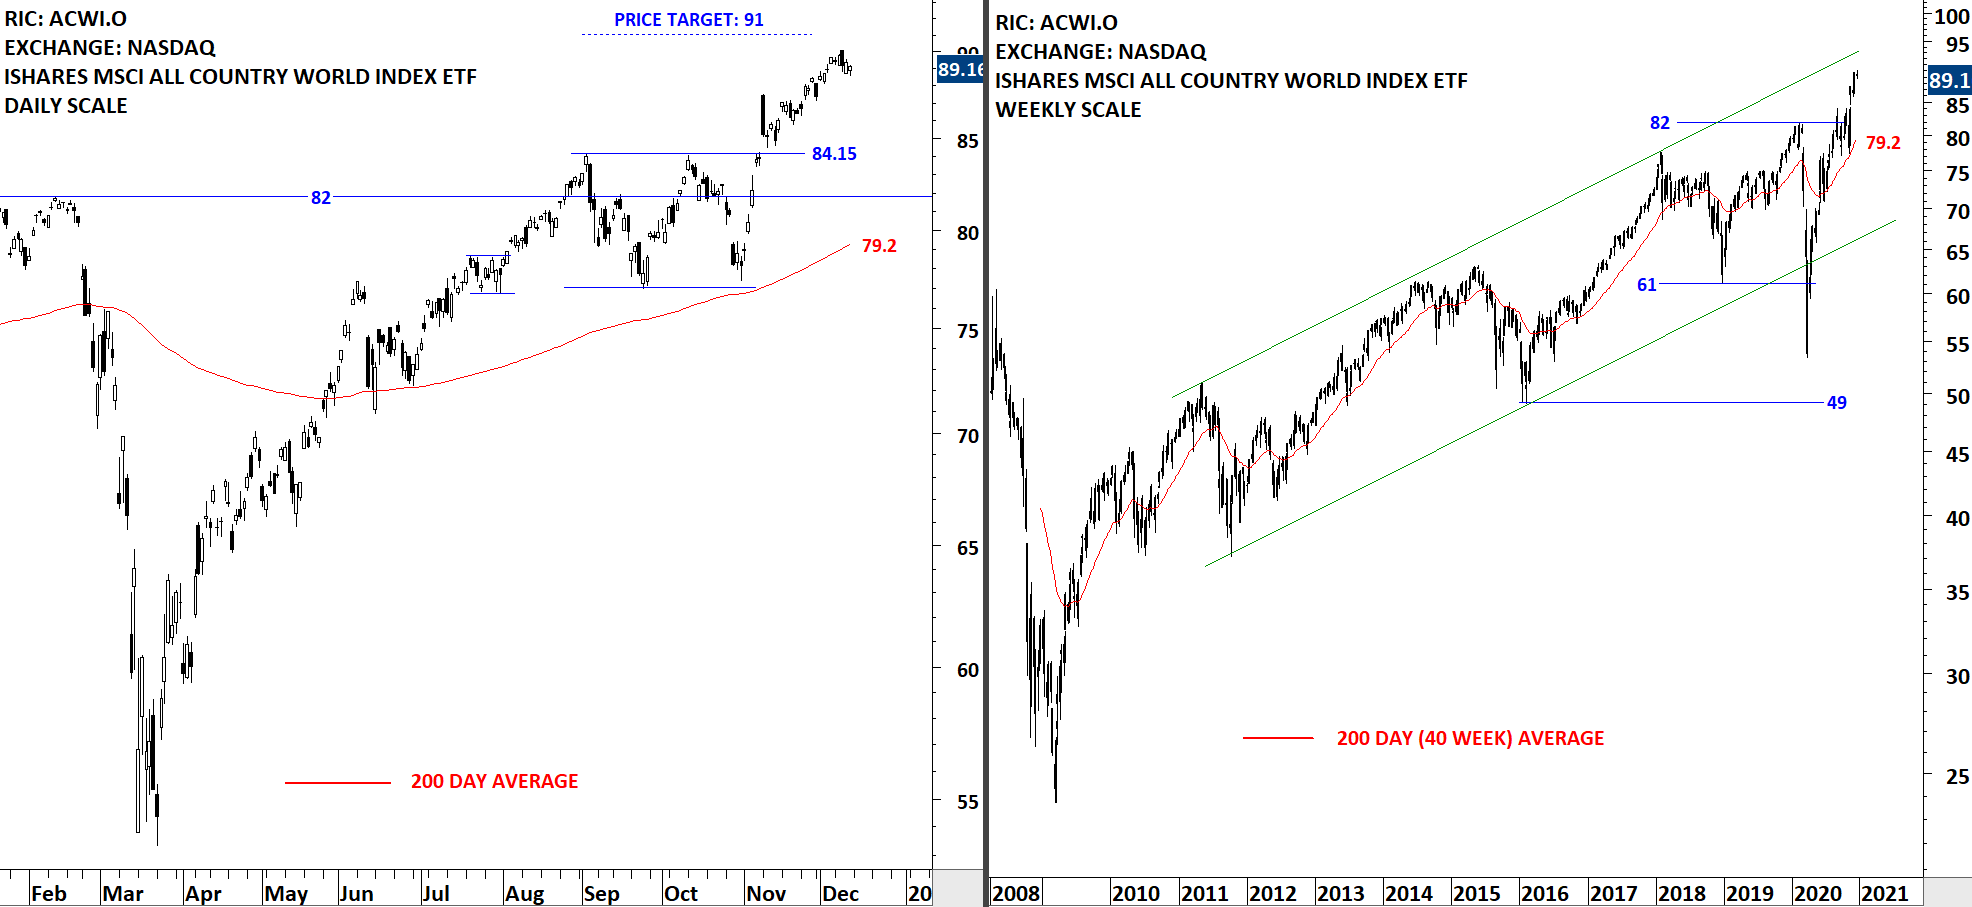
The benchmark for the Global equity markets performance, the iShares MSCI All Country World Index ETF (ACWI.O) resumed its uptrend after completing a rectangle chart pattern. Breakout took place above 84.15, the upper boundary of the rectangle which is now a short-term support. Possible chart pattern price target stands at 91 levels. During any pullback 84.15 will act as support. The 200-day moving average, which I utilize as a trend filter, is rising as well, now at 79.2 levels. There is no reversal chart pattern on the daily price chart.

Every week Tech Charts Global Equity Markets report features some of the well-defined, mature classical chart patterns under a lengthy watchlist and the chart pattern breakout signals that took place during that week. Global Equity Markets report covers single stocks from developed, emerging and frontier markets, ETF’s and global equity indices. The report starts with a review section that highlights the important chart developments on global equity benchmarks. This blog post features from the watchlist section Univar Solutions Inc. listed on the New York Stock Exchange.
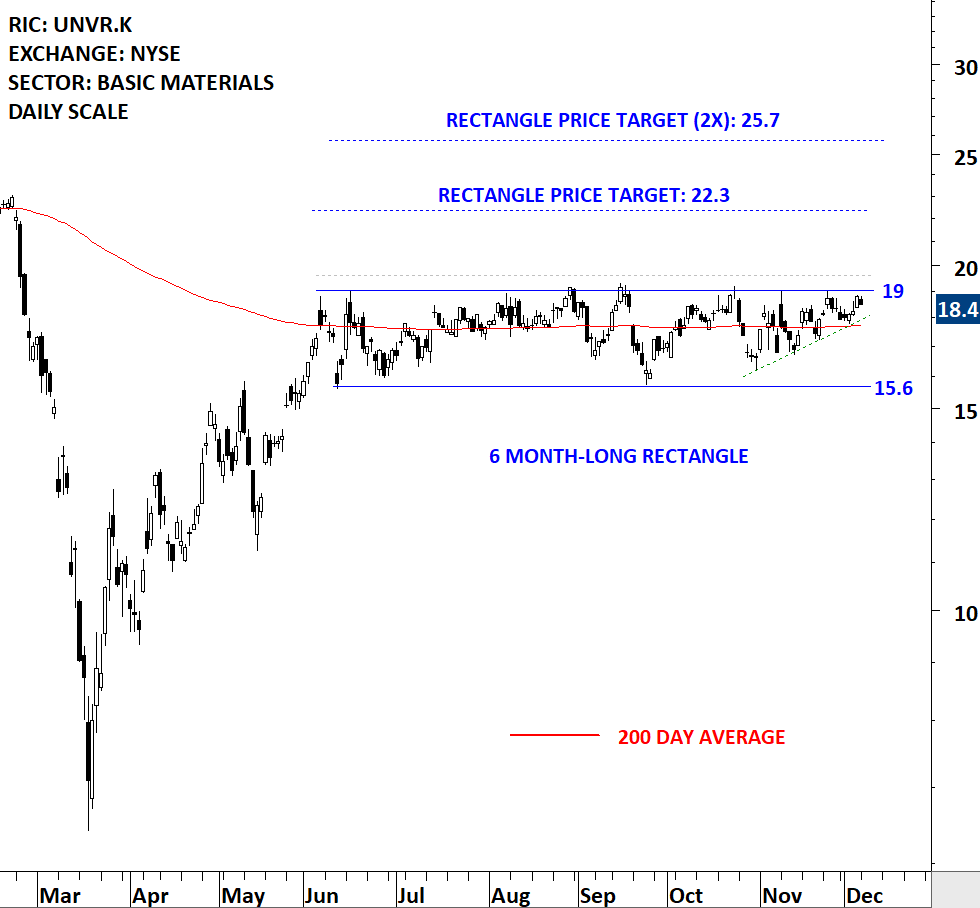
Univar Solutions Inc., formerly Univar Inc., is a global chemical and ingredient distributor and provider of value-added services. The Company operates through four segments: Univar USA, Univar Canada, Univar Europe and the Middle East and Africa and Latin America. The stock is listed on the New York Stock Exchange. Price chart formed a 6 month-long rectangle with the horizontal boundary acting as strong resistance at 19.00 levels. The horizontal boundary was tested several times over the course of the chart pattern. A daily close above 19.60 levels will confirm the breakout from the 6 month-long rectangle with the possible chart pattern price target of 22.3 levels. With tight and lengthy consolidations like these price can reach 2x the price objective. I added the 2x price target which is standing at 25.7 levels. (Data as of 07/12/2020)
By becoming a Premium Member, you’ll be able to improve your knowledge of the principles of classical charting.
With this knowledge, you can merge them with your investing system. In fact, some investors use my analyses to modify their existing style to invest more efficiently and successfully.
You will receive:
For your convenience your membership auto renews each year.

We are continuing our Member webinar series with several important and frequently asked topics. Given that the topics are different concepts in technical analysis/classical charting and trading, each section will have a +/- 10 min presentation followed by Q&A on that section.
Webinar Outline
Live questions from Members
Concept One 2:30
Concept Two 16:45
Link of interest
Concept Three 34:15
Concept Four 55:05
Concept Five 1:11:33
Additional questions 1:23:44
Link of interest
Recorded live 12.03.2020