Posts

GLOBAL EQUITY MARKETS – December 28, 2019

Dear Tech Charts members,

Another year is almost behind us. 2019 has been a productive year. Your communications and feedback has been helpful in improving the membership service and I'm thankful for that. Without your support I would not be able to put out this product. I hope the ideas, the educational content, webinars and reports have added value in your decision making. Guided and motivated by our members feedback and comments there will be several new additions to Tech Charts membership service in the new Year. I look forward to announcing them as the new Year progresses. I wish all of you a healthy and successful new Year and I would like to thank you for being a Tech Charts member.

Regards,

Aksel Kibar, CMT

REVIEW


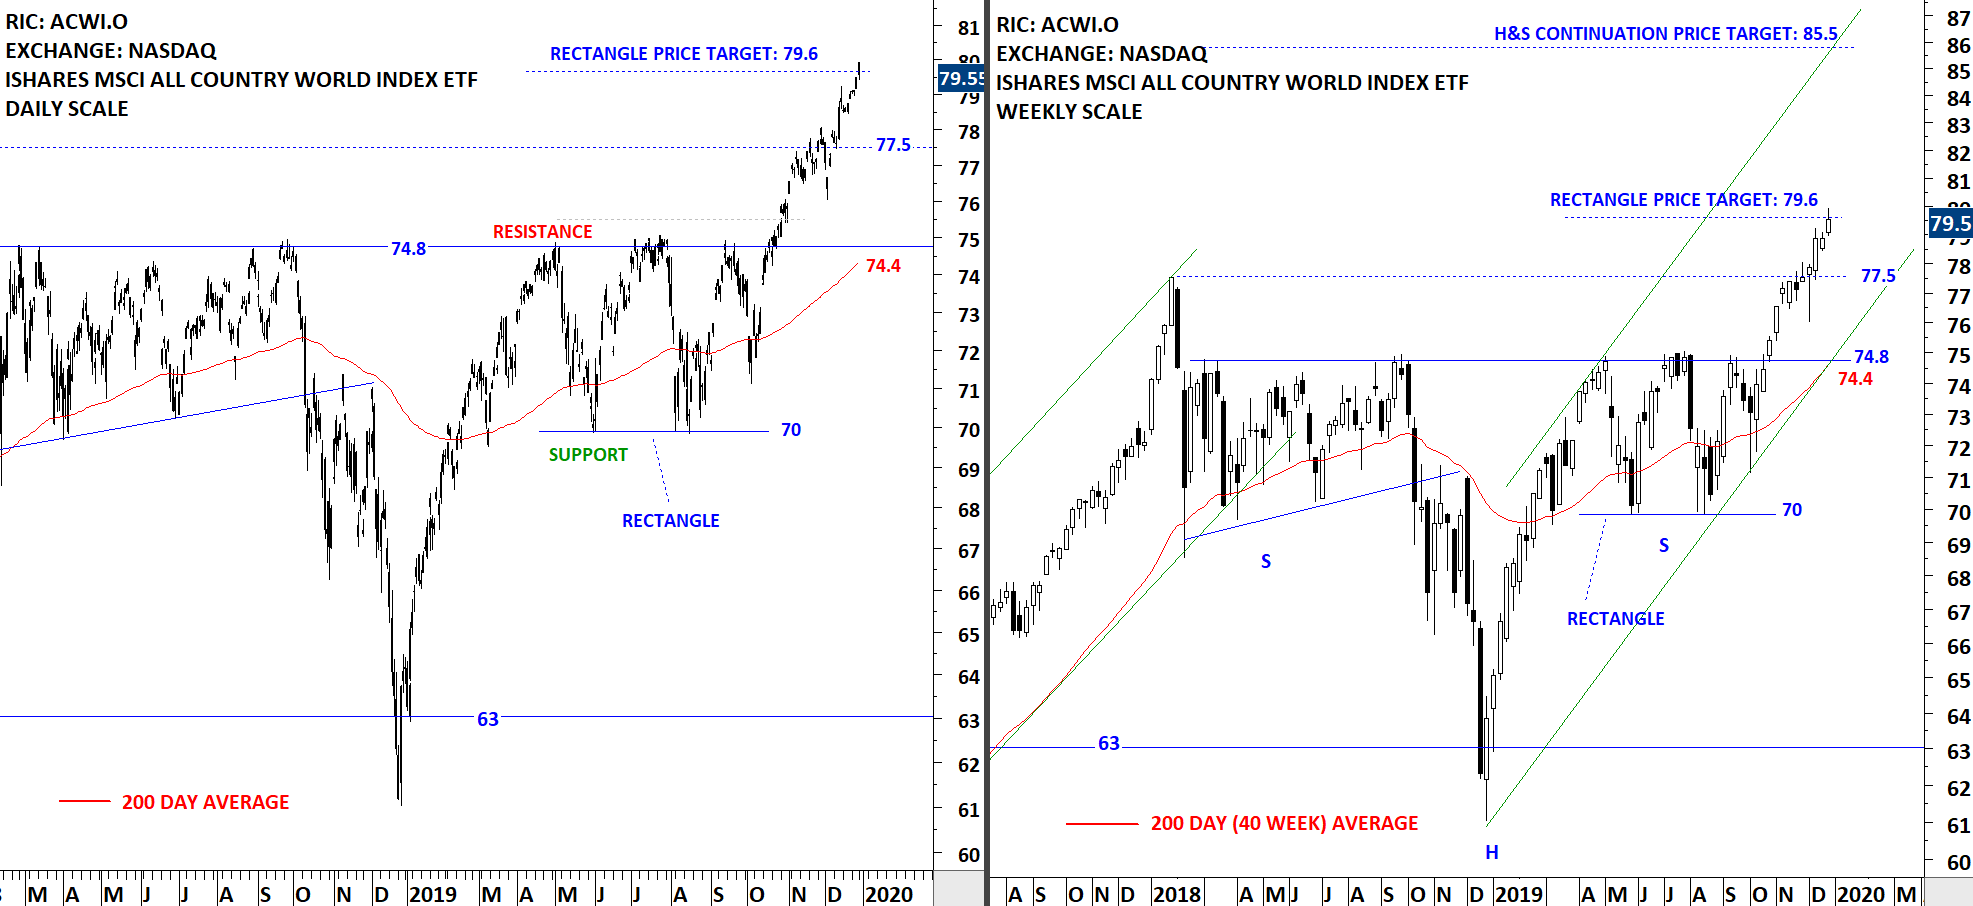
The benchmark for the Global equity markets performance, the iShares MSCI All Country World Index ETF (ACWI.O) reached its initial price target after completing both the rectangle and H&S continuation chart patterns. The right shoulder of a possible H&S continuation was identified as a rectangle with the price target of 79.6 levels. This week's price action pushed the ETF towards its rectangle chart pattern price target. Long-term chart pattern price objective stands at 85.5 levels. During any pullback, the high of 2018 (77.5) can act as support. Daily and weekly price charts show a steady uptrend.
Read More

GLOBAL EQUITY MARKETS – September 28, 2019

REVIEW


The benchmark for the Global equity markets performance, the iShares MSCI All Country World Index ETF (ACWI.O) reversed from the strong horizontal resistance at 74.8 levels. The pullback is possibly filling the gap between 72.5 and 73.5 area. Both the 200-day moving average and the minor high are forming support around 72.25 and 72.5 levels. A long-term breakout will take place only if the ETF clears the horizontal resistance at 74.8 levels. Larger scale chart pattern can be identified as a H&S continuation. Since April 2019, the ETF is trading between 70 and 74.8 levels.

Read More

GLOBAL EQUITY MARKETS – June 29, 2019

REVIEW


The benchmark for the Global equity markets performance, the iShares MSCI All Country World Index ETF continues to remain in a range between the horizontal resistance at 74.8 and the 200-day moving average at 71.4 levels. In the previous report I discussed the possibility of a H&S continuation chart pattern with the neckline standing at 74.8 levels. Price can continue to consolidate between the two important technical levels. A breakout above the horizontal resistance will be very positive for Global equities.

Read More

GLOBAL EQUITY MARKETS – April 27, 2019

REVIEW


The benchmark for the Global equity markets performance, the iShares MSCI All Country World Index ETF (ACWI.O), found resistance at the important horizontal resistance at 74.8 levels. Given the magnitude of the strong rebound and the steady rise without any pullback, one can't rule out the possibility of a breather/pause around the resistance at 74.8 levels. If we see a pullback, the 200-day moving average which is currently at 70.8 levels can act as support.

Read More

GLOBAL EQUITY MARKETS – April 20, 2019

REVIEW


The benchmark for the Global equity markets performance, the iShares MSCI All Country World Index ETF (ACWI.O), is now very close to a horizontal resistance at 74.8 levels. Given the magnitude of the strong rebound and the steady rise without any pullback, one can't rule out the possibility of a breather/pause around the resistance at 74.8 levels. If we see a pullback, the 200-day moving average which is currently at 70.6 levels can act as support.

Read More

GLOBAL EQUITY MARKETS – March 30, 2019

REVIEW


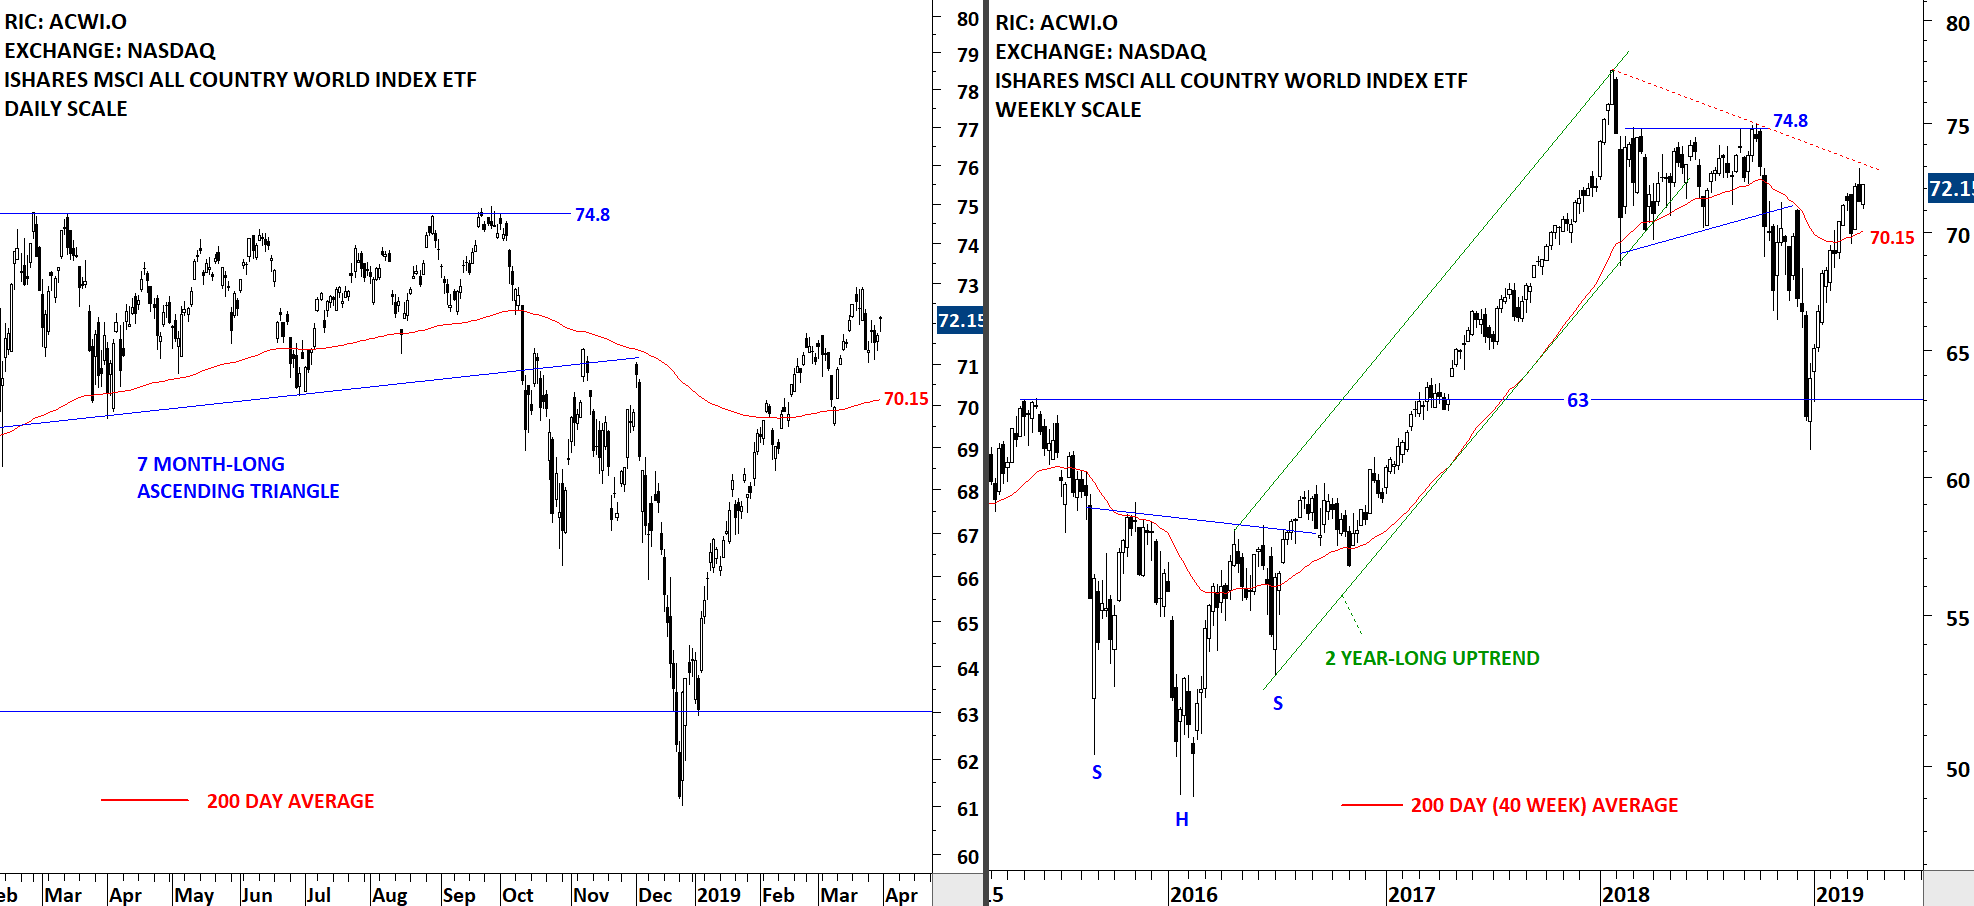
The benchmark for the Global equity markets performance, the iShares MSCI All Country World Index ETF (ACWI.O) is trying to find direction above its long-term average. We can see choppy price action around the 200-day average. More important is how the index will consolidate around the average. If it forms an orderly, recognizable short-term consolidation (in the form of a flag, pennant, rectangle, symmetrical triangle) I will conclude that the index is preparing for a new leg up. 200-day moving average is forming support at 70.15 levels.

Read More

GLOBAL EQUITY MARKETS – July 29, 2017

REVIEW


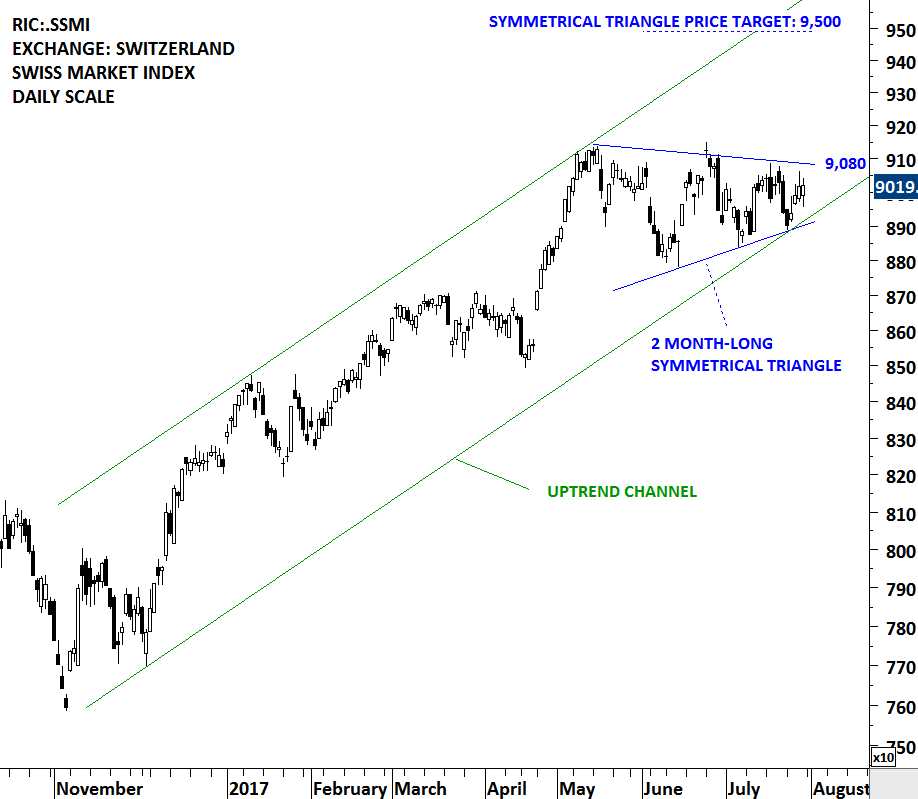
Swiss Market Index is possibly preparing for a breakout from its 2 month-long sideways consolidation. Last 2 month's price action can be identified as a symmetrical triangle and it can act as a bullish continuation. The upper boundary of the triangle stands as resistance at 9,080 levels. Symmetrical triangle possible chart pattern price target stands at 9,500 levels. Swiss benchmark equity index performed better than its European peers. This week's report features three different bullish chart developments on the Swiss financial stocks. Swiss Market Index ETF is available in local (CHF) currency via iShares SMI ETF that is listed on the Swiss Exchange. Also, a USD denominated ETF is listed on the New York Stock Exchange via iShares MSCI Switzerland Capped ETF (EWL).

Read More