Posts

GLOBAL EQUITY MARKETS – December 8, 2018

Announcement: Dear Tech Charts members, We have included a new feature to Tech Charts website. At the bottom of each report we have incorporated comment platform DISQUS. Previous comment platform was not allowing members to post charts and have discussions. With this improvement, I hope to have detailed discussions with our members and possibly post breakout alerts related to each week's report. I also hope that Tech Charts members will be able to interact with each other through the DISQUS platform (at the bottom of each weekly report) to share their knowledge on different instruments available to take advantage of breakout opportunities. I hope we will all benefit from this new feature.

REVIEW


Global equity markets performance as measured by the iShares MSCI All Country World Index ETF (ACWI.O) reversed from its long-term moving average resistance at 71.3 levels. In the beginning of October the index broke down its 7 month-long consolidation and the 200-day moving average. Since then the ETF has challenged the strong resistance area between 71 and 71.5 levels but failed to breach higher. This week's sell-off pulled the ACWI ETF towards the minor support at 66.5 levels. Failure to hold above the short-term support can send the index to the next level at 63 levels. The iShares MSCI All Country World Index ETF is trading below its long-term average and is in a downtrend.

Read More

SUPPORT & RESISTANCE

A stock (ETF, Index etc.) price is either in a trending phase or in a consolidation period. During strong trend periods prices move uninterrupted from one price level to another. During consolidations prices move in both directions without producing any meaningful or sustained price change and will form well-defined support and resistance areas on the charts. A support range represents a concentration of demand, and a resistance range represents a concentration of supply.

A resistance level is an approximate level or fairly well-defined price range, where previously advancing stock meets resistance in the form of strong selling. A support level is an approximate level or price range where a preceding decline meets support, in the form of strong buying. A possible explanation for appearance of such well-defined price boundaries in the form of support and resistance can be the fact that the public tend to remember previous levels the stock has traded.

Read More

GLOBAL EQUITY MARKETS – October 28, 2017

REVIEW


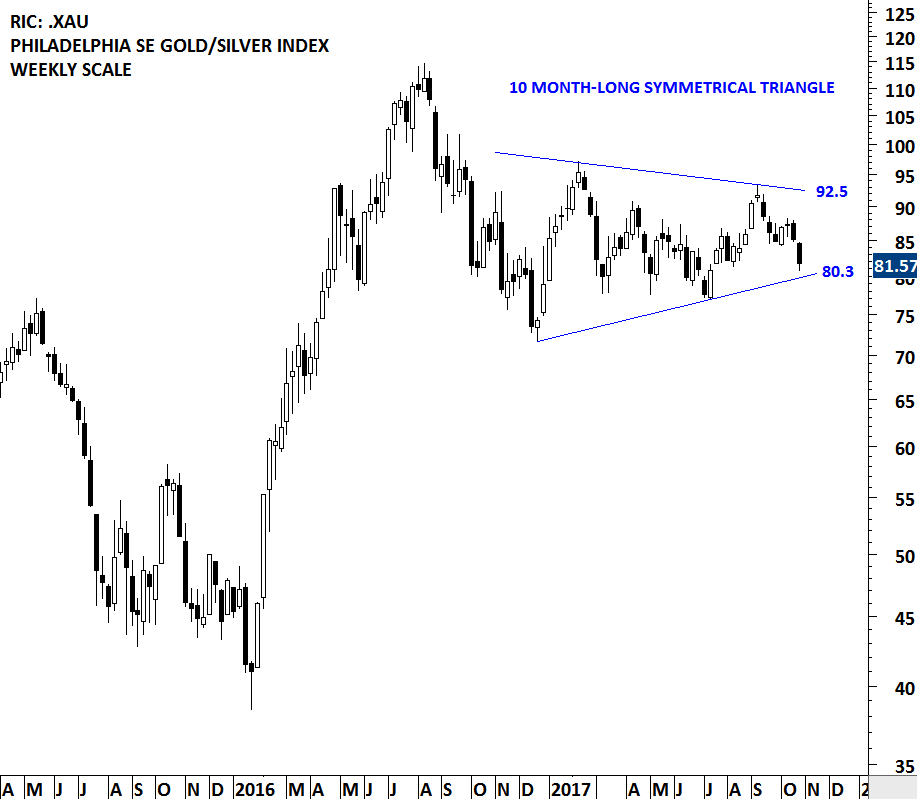
The XAU is a capitalization-weighted index of thirty precious metal mining companies that has been traded on the Philadelphia Stock Exchange since 1983. As its name suggests it includes both gold and silver mining companies. In order to track gold and silver mining companies performance in an index there are several options available for investors, but the two most watched indices are: the NYSE Arca Gold BUGS (Basket of Unhedged Gold Stocks) Index (called the HUI Index) and Philadelphia Gold and Silver Index (called the XAU Index). Below chart features the Philadelphia Gold and Silver Index. Also this week's report highlights several great bearish chart setups on Silver mining equities and ETFs.

Over the past 10 months the Philadelphia Gold and Silver Index has been in a sideways consolidation. The index is possibly forming a symmetrical triangle that can act as a bearish continuation chart pattern. Several bearish chart setups in the junior mining companies and ETFs suggest that mining stocks can come under selling pressure in the following weeks. The lower boundary of the 10 month-long symmetrical triangle stands at 80.3 levels. This week's price action reached the lower boundary of the possible symmetrical triangle. I will monitor the strong support at 80.3 in the following weeks. A breakdown of the multi-month consolidation can result in a downward trend on the XAU index.

Read More

GLOBAL EQUITY MARKETS – October 21, 2017

REVIEW


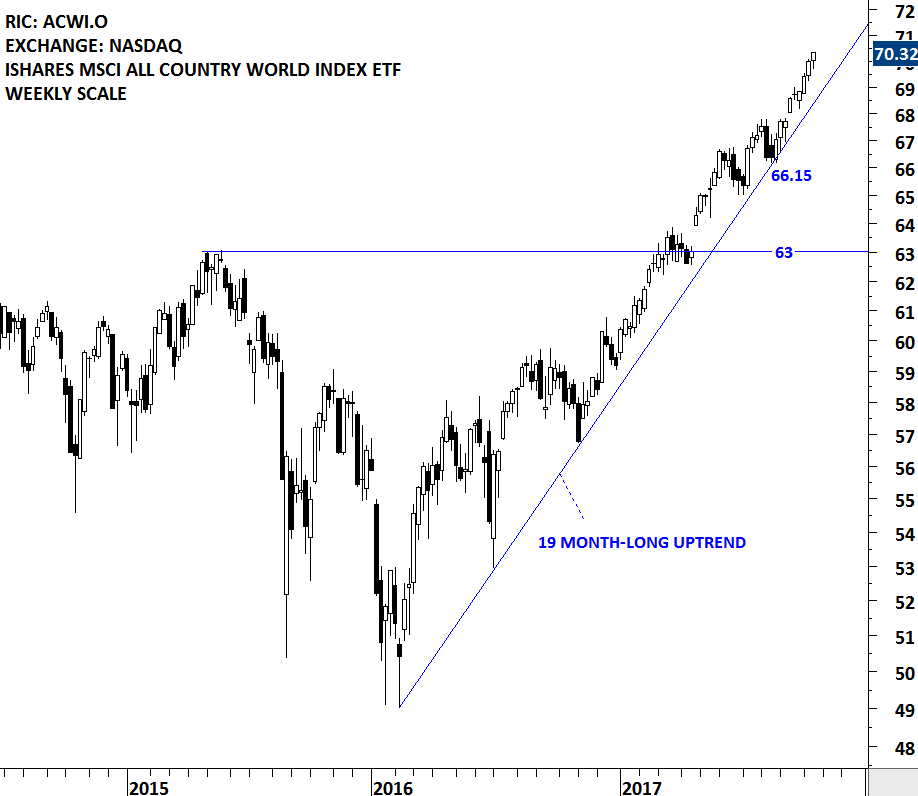
This was another week of strong global equity market performance. Benchmark for the global equity market performance, the MSCI All Country World Index ETF (ACWI.O) remains in an uptrend above its 19 month-long trend support. Both the long and short-term charts are showing steady uptrend for the ACWI. At this point there is no clear chart pattern that would suggest a reversal of the strong uptrend.

Read More

GLOBAL EQUITY MARKETS – October 7, 2017

REVIEW


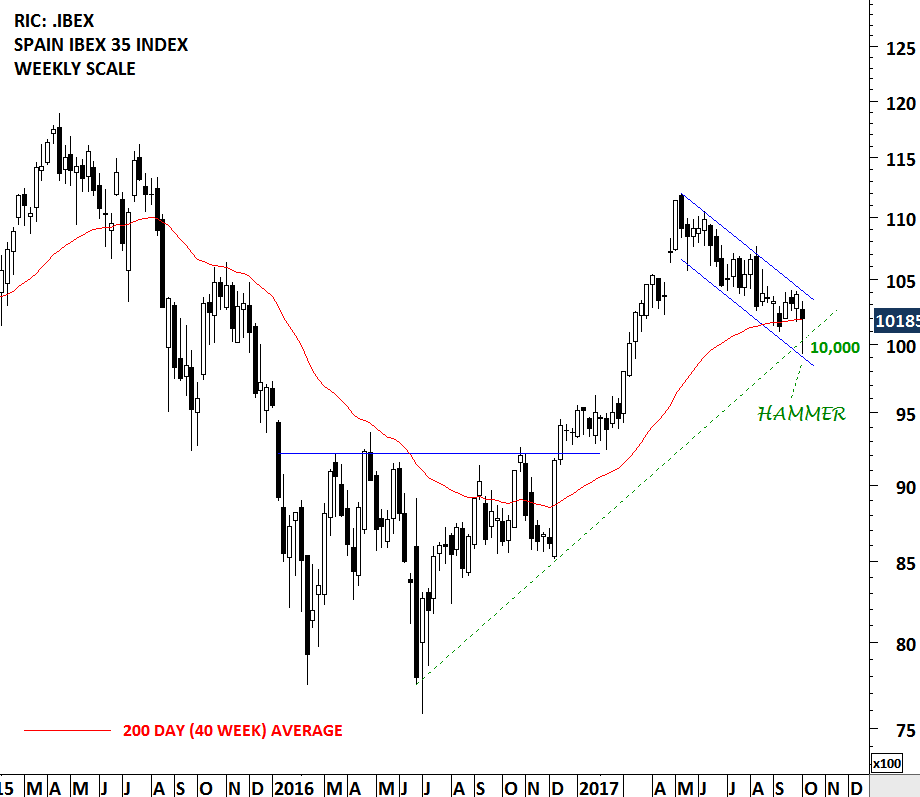
It has been a volatile week for Spanish politics and the country's financial assets. Spain's IBEX 35 index has been trending lower since May 2017. The downtrend in the short-term formed a well-defined trend channel. With this week's sell-off, the index rebounded from the lower boundary of the trend channel. There is no classical chart pattern that would suggest that index is finding a bottom or another chart pattern development that would signal further downside. However, two interesting candlestick patterns drew my attention which I find worth mentioning.

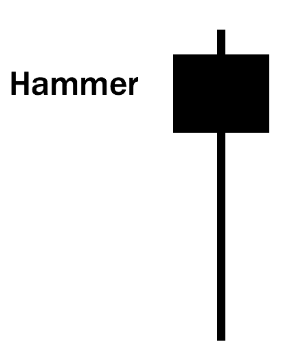
At inflection points, markets give clues about the internal dynamics of the price action. These are better identified on candlestick charts. The weekly chart of the IBEX 35 index formed a hammer. This bullish reversal candlestick pattern becomes more important if it forms at important support areas. We can see 3 important technical levels overlapping at 10,000 levels. These are; the lower boundary of the 5 month-long downward sloping trend channel, the 200 day (40 week) moving average and the year-long upward trend line.


Hammer is a bullish reversal pattern that forms after a decline. In addition to a potential trend reversal, hammers can mark bottoms or support levels. After a decline, hammers signal a bullish revival. The low of the long lower shadow implies that sellers drove prices lower during the session. However, the strong finish indicates that buyers regained their footing to end the session on a strong note. While this may seem enough to act on, hammers require further bullish confirmation. Confirmation could come from a gap up or long white candlestick.


Read More

GLOBAL EQUITY MARKETS – August 26, 2017

REVIEW


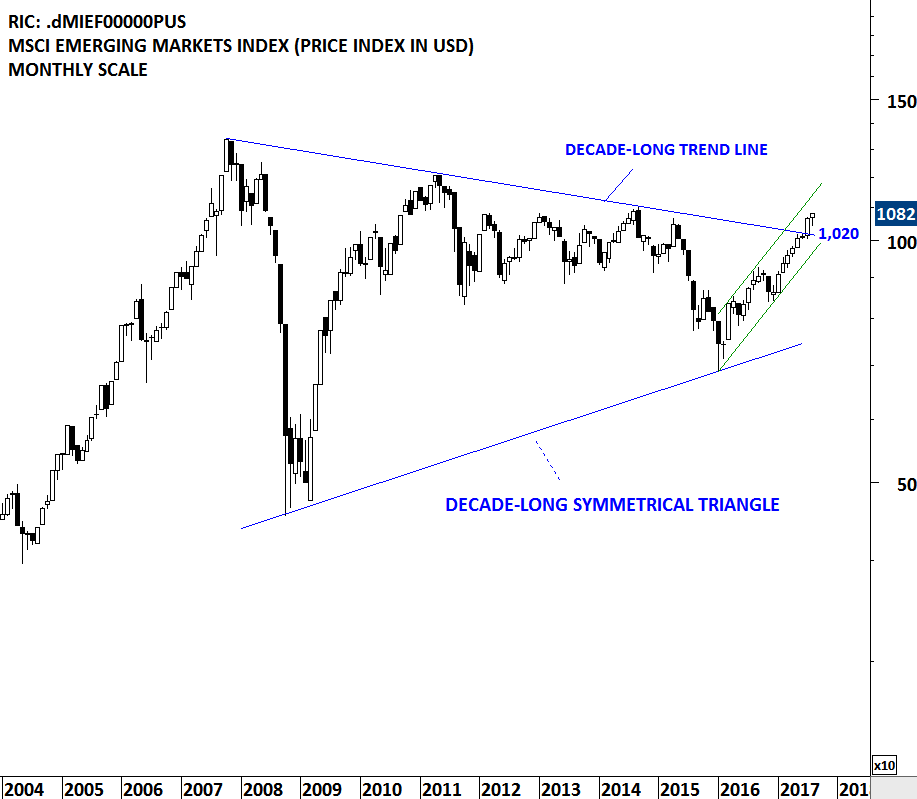
Strong weekly performance of the Chinese SSE Composite Index is worth mentioning in this weeks update. Strength in the Chinese equities helped MSCI Emerging Markets Index to remain resilient during the last few week's of global equity market weakness. MSCI Emerging Markets index that cleared decade-long trend resistance in July, held on to its earlier gains during the month of  August.

Read More