Posts

GLOBAL EQUITY MARKETS – October 6, 2018

REVIEW


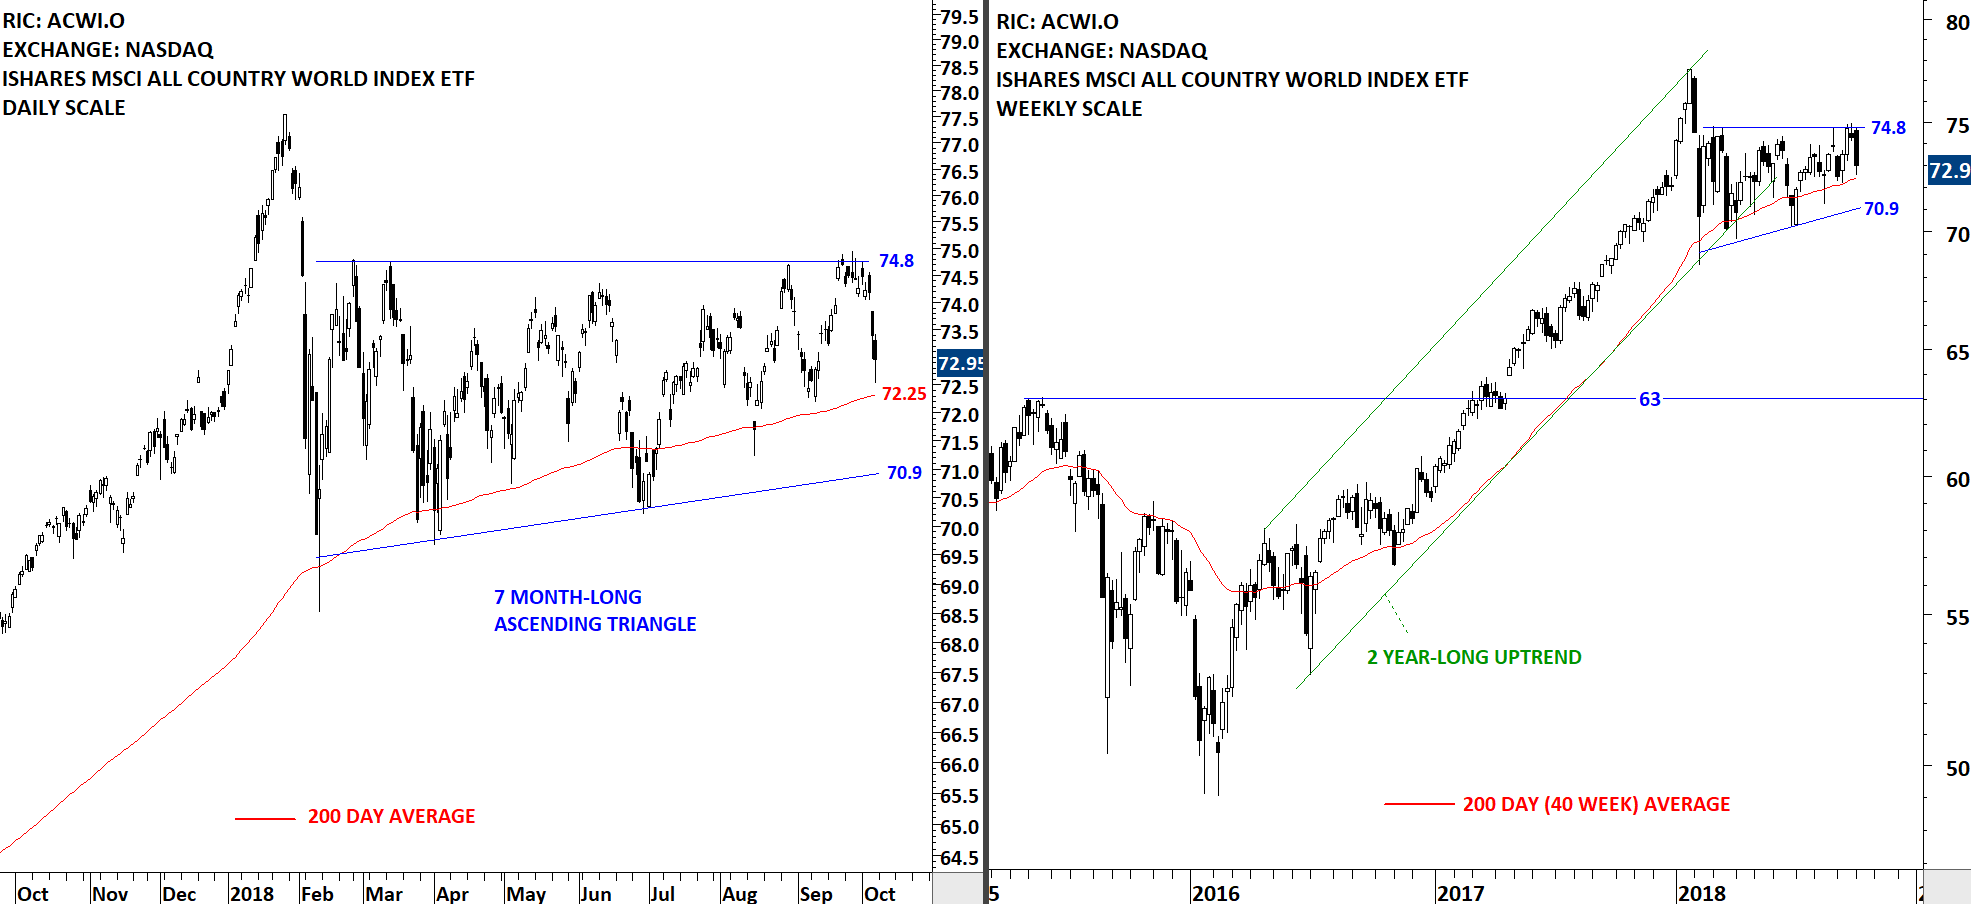
If one needs to explain what "trend less" market looks like, there is no better example other than the iShares MSCI All Country World Index ETF (ACWI.O). Since the beginning of the year the ACWI ETF is stuck in a tight range between 75 and 70. Usually a low volatility period like this is followed by a strong directional movement. ACWI ETF has strong resistance at 74.8 and support at 70.9 levels. The ETF is still holding above its long-term average.
Read More

ALLEGHENY TECHNOLOGIES INC (ATI)

Every week Tech Charts Global Equity Markets report features some of the well-defined, mature classical chart patterns under a lengthy watchlist and the chart pattern breakout signals that took place during that week. Global Equity Markets report covers single stocks from developed, emerging and frontier markets, ETF’s and global equity indices. The report starts with a review section that highlights the important chart developments on global equity benchmarks. This blog post features a bullish ascending triangle chart pattern on Allegheny Technologies Inc. listed on the New York Stock Exchange.

Read More

GLOBAL EQUITY MARKETS – September 29, 2018

REVIEW


On Tuesday we had our members webinar and we discussed symmetrical triangles. We received very positive feedback from our members. A recorded version of the webinar will be uploaded on the website for our premium members. We will inform you via e-mail when it is on the Tech Charts website. During the Q&A section one of our members brought to my attention the possibility of labeling the symmetrical triangle chart pattern on the iShares MSCI All Country World Index ETF (ACWI.O) as an ascending triangle. Ascending triangle has a bullish bias when compared with a symmetrical triangle. Given that the price respected the horizontal resistance at 74.8, I labelled the chart below with the ascending triangle interpretation. It is important to note that Global equities performance as measured by the iShares MSCI All Country World Index ETF is going through an extreme low volatility period. Usually these type of low volatility periods are followed by strong directional movement. Price for the ACWI is still trading in a tight range between 70.8 and 74.8.

Read More

GLOBAL EQUITY MARKETS – July 28, 2018

REVIEW


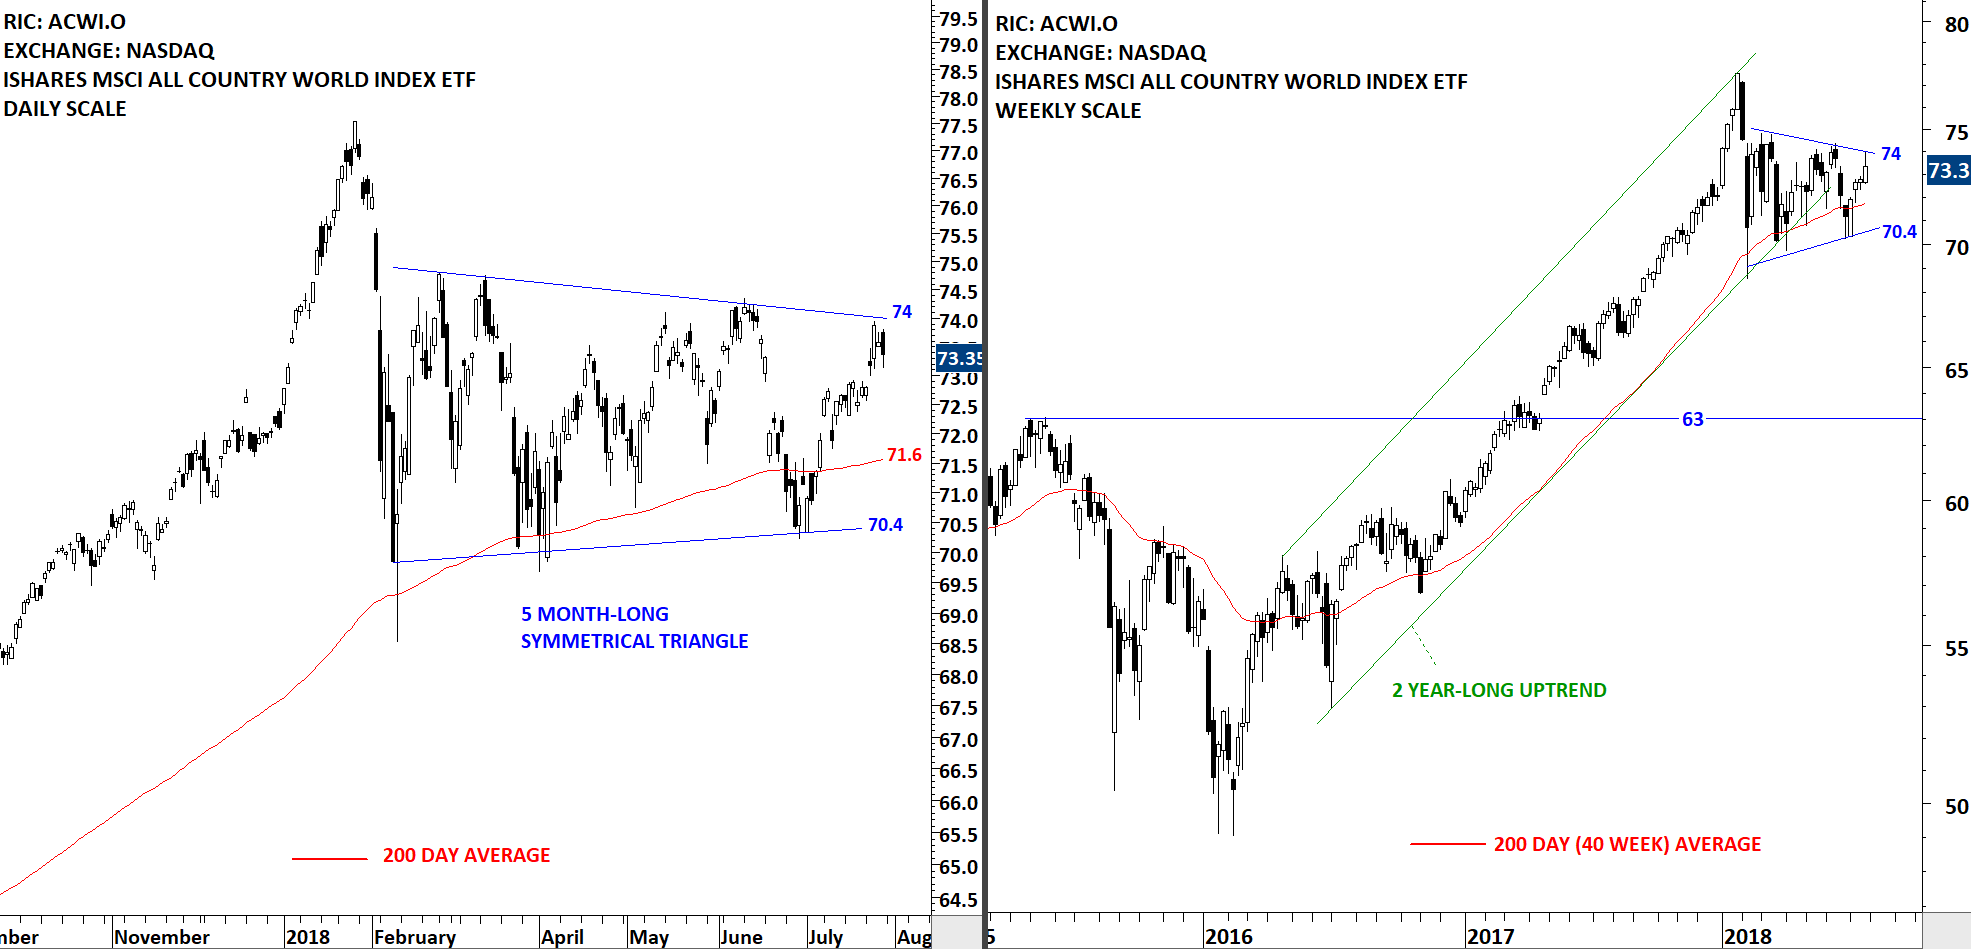
The iShares MSCI All Country World Index ETF (ACWI.O) found resistance at the upper boundary of its 5 month-long consolidation. Last 5 month's price action can be identified as a possible symmetrical triangle with the upper boundary acting as resistance at 74 levels and the lower boundary as support at 70.4 levels. I track ACWI ETF to measure Global equity markets performance. Price continues to remain range-bound.

Read More