Posts

GLOBAL EQUITY MARKETS – February 10, 2018

REVIEW


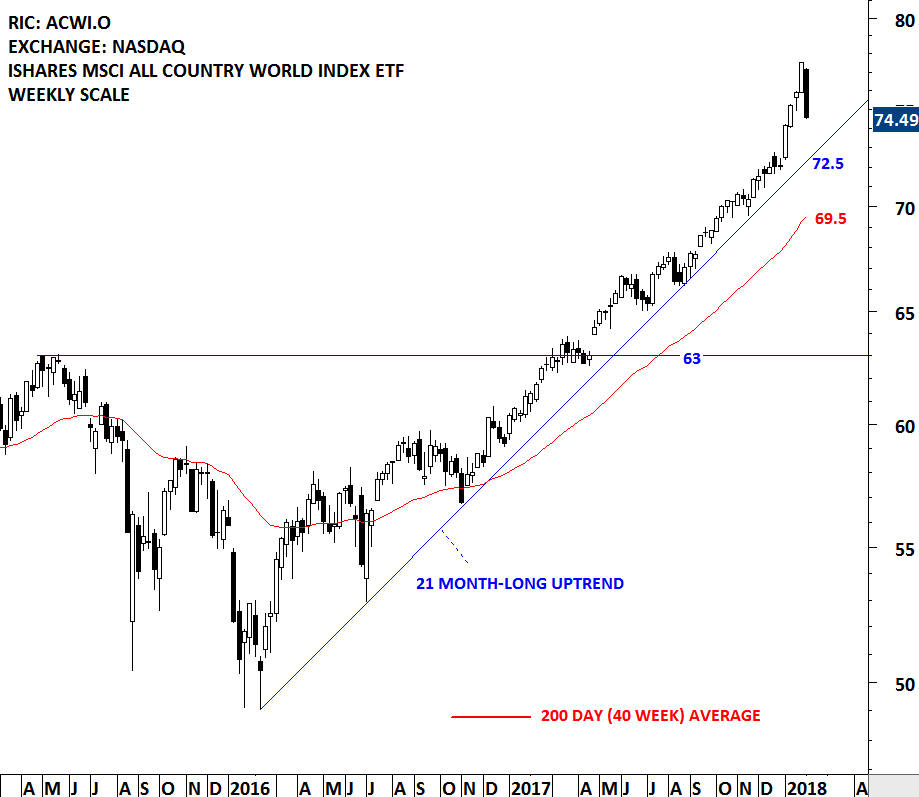
Global equity benchmarks deviated far from the averages that a 10% correction in 2 weeks is still considered a reversion to the mean. With this week's continued sell-off both benchmarks for Global equities, the iShares MSCI All Country World Index ETF and the iShares MSCI Emerging Markets Index ETF reached their respective 200-day (40 week) moving averages. The 200-day moving average and the lower boundary of multi-month long upward trend channels are forming support around the same levels. Read More

GLOBAL EQUITY MARKETS – February 3, 2018

REVIEW


2018 started with strong weekly gains. The steady uptrend on the iShares MSCI All Country World Index ETF took a steep shape in January due to back to back long weekly candlesticks. This week's sharp reversal gave back last two week's gains. From a classical charting perspective we don't have enough evidence to call the latest reversal a "market top". Multi month-long uptrend is still intact. We are currently experiencing a reversion back to the averages or to the long-term trend line supports. Global equities can retrace further and major equity benchmarks can still remain in their long-term uptrends. We will need more evidence in the following weeks.

Read More

GLOBAL EQUITY MARKETS – January 27, 2018

REVIEW


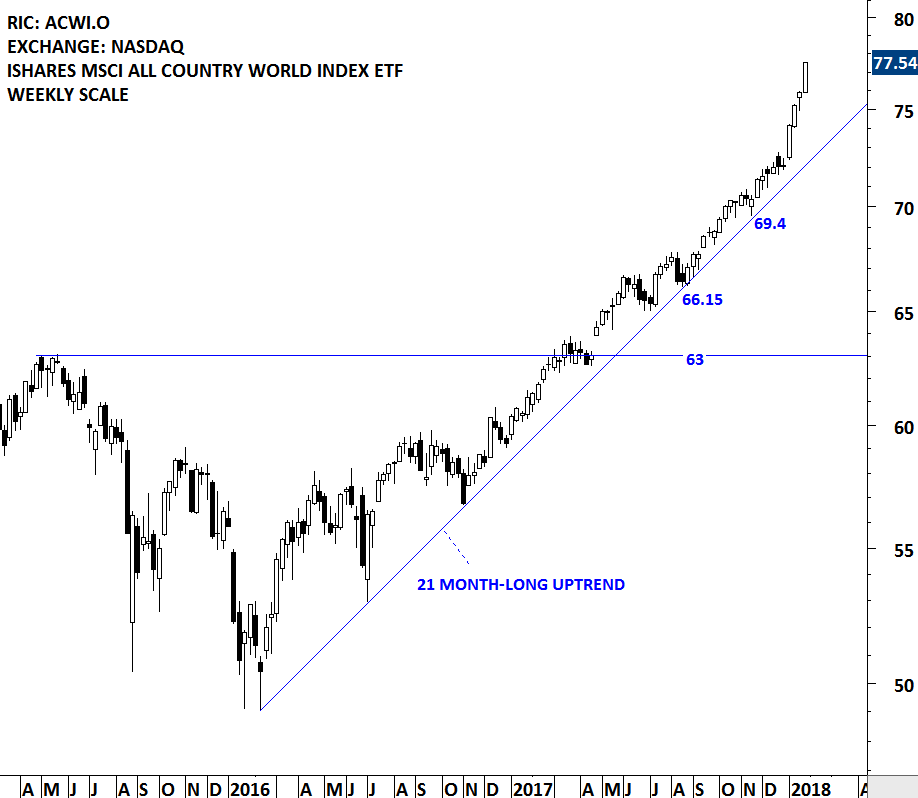
This was another strong week for the Global Equity Markets. The iShares MSCI All Country World Index ETF, a benchmark for global equity markets performance, continued to resume its strong uptrend above the 21 month-long upward trend. The uptrend has taken a parabolic shape. Parabolic price action is not sustainable. Short-term pullback and reversion to the mean is a possibility. At this point there is no clear chart pattern that would suggest a trend reversal.

Read More

GLOBAL EQUITY MARKETS – January 20, 2018

REVIEW


Strength in the Chinese equities started with a breakout on the China Large Caps. However, over the past year the performance for the broad market in China as shown by the China SSE Composite Index was not impressive when compared with China Large Cap ETF (FXI). In the second half of 2017, the SSE Composite index completed an 8 month-long rectangle. Following the breakout the index lacked follow through. SSE Composite Index spent the second half of 2017 by pulling back to the chart pattern boundary at 3,300 levels and to the long-term 200 day (40 week) moving average. Since the beginning of the year we have seen a strong performance on the SSE Composite Index with strong back to back weekly gains. Initial price target for the 8 month-long rectangle stands at 3,560 levels. More important than the short-term price target, current technical outlook might be signaling a new multi-month long uptrend developing for the Chinese equities.

Read More

GLOBAL EQUITY MARKETS – January 6, 2018

Announcement: I will be speaking at the Dubai Traders Summit organized by MetaStock on April 26th. Over the past decade I worked for institutions in the region, managing funds & portfolios as well as analyzing Emerging and Frontier markets. At this one day event I hope to connect with Tech Charts members & followers, ex-colleagues and fellow traders to discuss some of the best classical chart patterns that helped me in making trading and investment decisions. Registration is free. You can follow this link to register >> DUBAI TRADERS SUMMIT APRIL 26th.

REVIEW


Global Equity Markets started the new year on a high note. Back to back gains pushed the iShares MSCI All Country World Index towards the upper boundary of its upward trend channel. Strong uptrend remains intact. If the year-long upward trend channel is valid, the upper boundary can act as a short-term resistance. There is no chart pattern that would suggest a trend reversal at this point.

Read More

GLOBAL EQUITY MARKETS – November 25, 2017

REVIEW


The MSCI Domestic U.S. Real Estate Index and related REIT ETFs are going through a lengthy consolidation. Breakouts from tight and lengthy consolidations are usually followed by strong directional movement. Price index respected the boundaries of the 9 month-long symmetrical triangle. Both boundaries were tested several times over the past months. The upper boundary of the possible symmetrical triangle is acting as resistance at 1,180 levels and the lower boundary as support at 1,140 levels. A decisive breakout above 1,180 levels will confirm the symmetrical triangle as a bullish continuation with a possible chart pattern price target of 1,255 levels. Below you can find related ETFs to take advantage of a possible directional movement on the MSCI Domestic US Real Estate Price Index.

Read More

GLOBAL EQUITY MARKETS – October 21, 2017

REVIEW


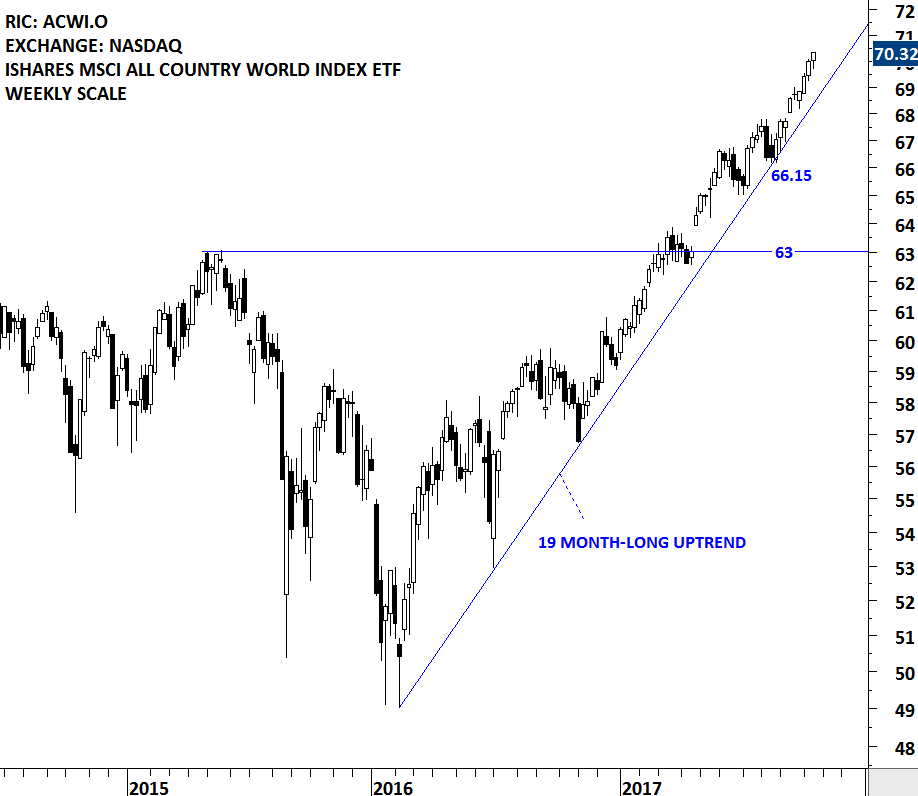
This was another week of strong global equity market performance. Benchmark for the global equity market performance, the MSCI All Country World Index ETF (ACWI.O) remains in an uptrend above its 19 month-long trend support. Both the long and short-term charts are showing steady uptrend for the ACWI. At this point there is no clear chart pattern that would suggest a reversal of the strong uptrend.

Read More

GLOBAL EQUITY MARKETS – October 7, 2017

REVIEW


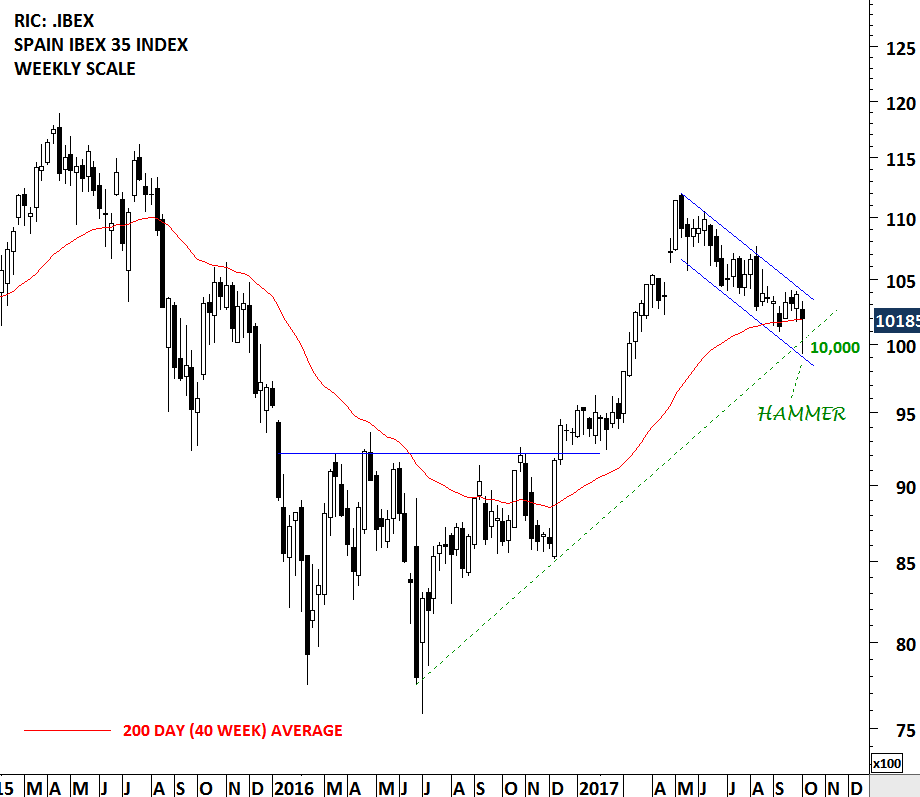
It has been a volatile week for Spanish politics and the country's financial assets. Spain's IBEX 35 index has been trending lower since May 2017. The downtrend in the short-term formed a well-defined trend channel. With this week's sell-off, the index rebounded from the lower boundary of the trend channel. There is no classical chart pattern that would suggest that index is finding a bottom or another chart pattern development that would signal further downside. However, two interesting candlestick patterns drew my attention which I find worth mentioning.

At inflection points, markets give clues about the internal dynamics of the price action. These are better identified on candlestick charts. The weekly chart of the IBEX 35 index formed a hammer. This bullish reversal candlestick pattern becomes more important if it forms at important support areas. We can see 3 important technical levels overlapping at 10,000 levels. These are; the lower boundary of the 5 month-long downward sloping trend channel, the 200 day (40 week) moving average and the year-long upward trend line.
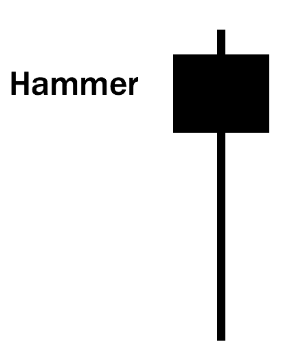

Hammer is a bullish reversal pattern that forms after a decline. In addition to a potential trend reversal, hammers can mark bottoms or support levels. After a decline, hammers signal a bullish revival. The low of the long lower shadow implies that sellers drove prices lower during the session. However, the strong finish indicates that buyers regained their footing to end the session on a strong note. While this may seem enough to act on, hammers require further bullish confirmation. Confirmation could come from a gap up or long white candlestick.

Read More

GLOBAL EQUITY MARKETS – September 16, 2017

REVIEW


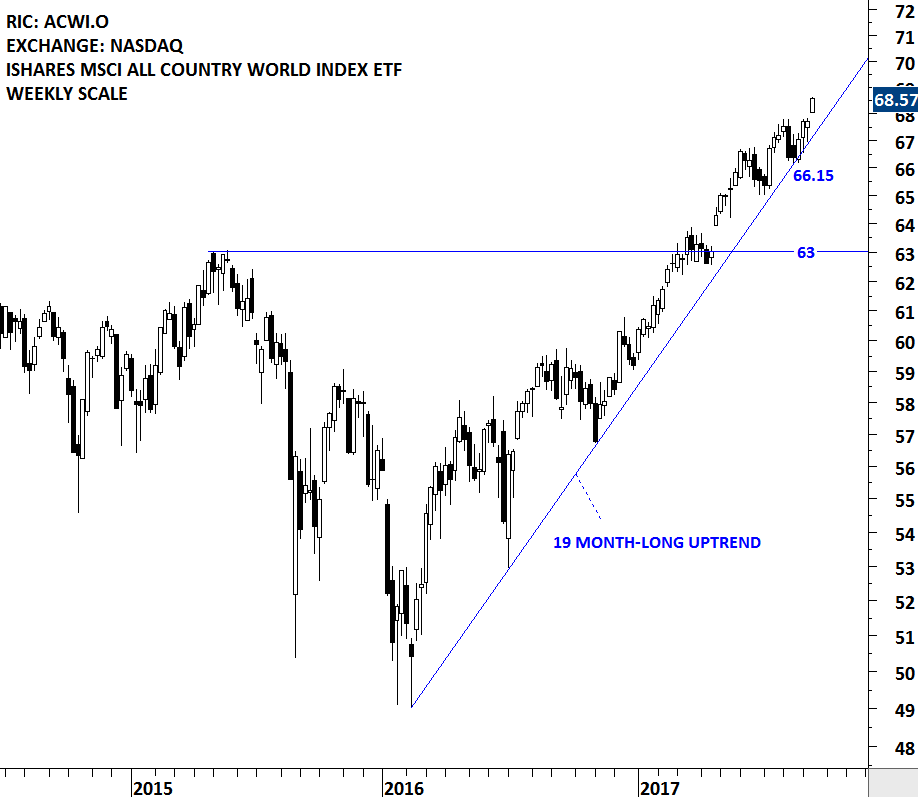
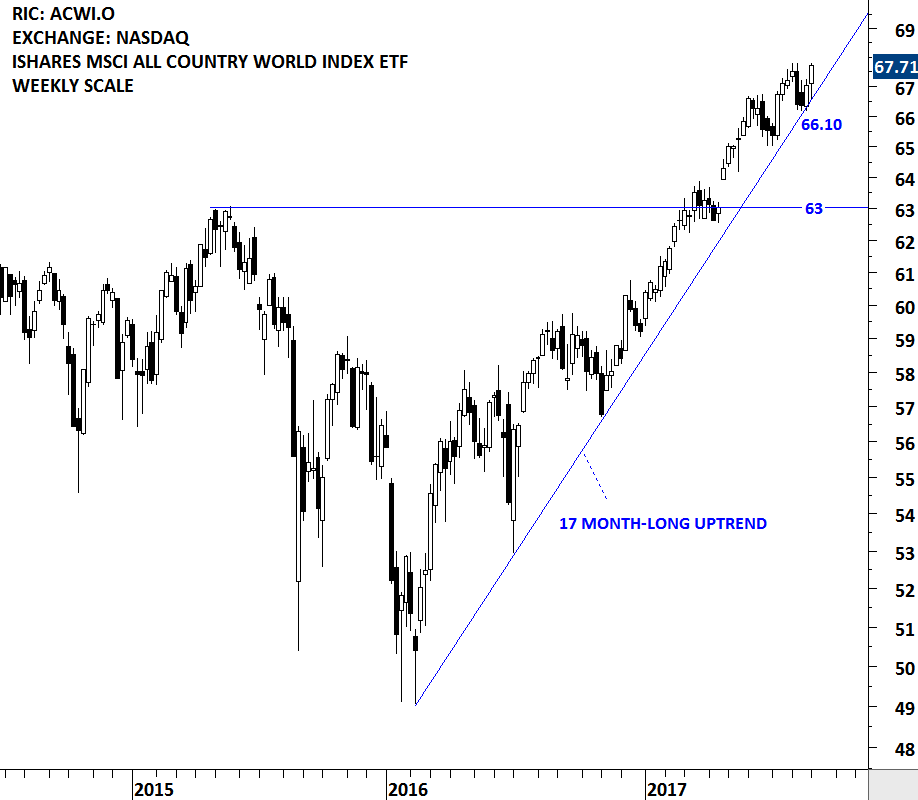
Global equity markets continue to remain in a steady uptrend. iShares MSCI All Country World Index, a benchmark for global equity market performance, continued to hold above its multi month-long upward trend line. The minor low and the upward sloping trend line are forming support at 66.15 levels. Uptrend is intact.

Read More

GLOBAL EQUITY MARKETS – September 2, 2017

REVIEW


The iShares MSCI ACWI ETF seeks to track the investment results of an index composed of large and mid-capitalization developed and emerging market equities. It is a good measure of Global equity markets performance. The ETF is listed on the Nasdaq Stock Exchange. Over the past few weeks, the Global Equity Markets report reviewed the ACWI ETF and highlighted the importance of the multi-month uptrend and the trend line support. Last two week's price action rebounded from the steep trend line support at 66.10 levels and challenged the all-time highs. The long-term up trend is still intact and the multi-month trend support has become even more important. The more a technical level is tested the more important that level becomes. For now, our conclusion is that, the benchmark for global equity market performance is still moving higher with an important support (minor low and multi-month upward  trend line) standing at at 66.10 levels.

Read More