Posts

GLOBAL EQUITY MARKETS – March 3, 2018

Reminder on Live Webinar

Due to very positive feedback we got for the last webinar on rectangle chart patterns, we are continuing the webinar series with another reliable horizontal chart pattern; the ascending triangle. Live Webinar and Q&A with Aksel - Thursday, March 8, 11am mountain. You can register here (Register for the Live Webinar)


REVIEW


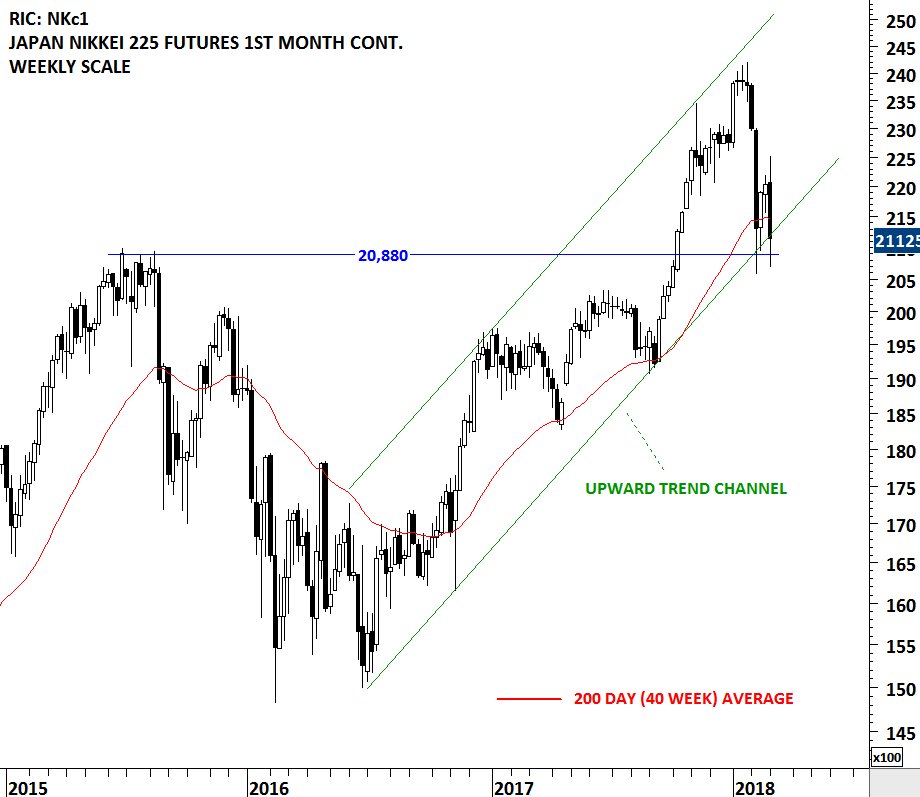
Equity indices that had weak rebound from the lows, tested the same support areas. Japan's Nikkei Index is one of them. On the weekly scale we can see that the upward trend channel is still intact with the support forming at 20,880 levels. On the daily scale price chart (futures price data to capture Friday's close) we can see that the Friday's recovery on U.S. indices helped the Nikkei Futures to form a Doji candlestick at the support. Failure to hold these levels can result in a larger scale correction. In the short-term Japan's Nikkei will try to find support around 20,880 levels and if it succeeds we will possibly label the price action as a double bottom.
Read More

RECTANGLE – TRADING RANGE

A stock (ETF, Index etc.) price is either in a trending phase or in a consolidation period. During strong trend periods prices move uninterrupted from one price level to another. During consolidations prices move in both directions without producing any meaningful or sustained price change and will form well-defined support and resistance areas on the charts. A support range represents a concentration of demand, and a resistance range represents a concentration of supply.

A resistance level is an approximate level or fairly well-defined price range, where previously advancing stock meets resistance in the form of strong selling. A support level is an approximate level or price range where a preceding decline meets support, in the form of strong buying. A possible explanation for appearance of such well-defined price boundaries in the form of support and resistance can be the fact that the public tend to remember previous levels the stock has traded.

The longer the time which the stock spent in that range, therefore, the greater the number of transactions, the more important that range becomes for future technical consideration. In applying support and resistance study to price charts, the weekly scale time frame is usually more informative than daily scale. Weekly charts show much more plainly the levels at which congestion of significant duration appeared.

Read More

GLOBAL EQUITY MARKETS – February 10, 2018

REVIEW


Global equity benchmarks deviated far from the averages that a 10% correction in 2 weeks is still considered a reversion to the mean. With this week's continued sell-off both benchmarks for Global equities, the iShares MSCI All Country World Index ETF and the iShares MSCI Emerging Markets Index ETF reached their respective 200-day (40 week) moving averages. The 200-day moving average and the lower boundary of multi-month long upward trend channels are forming support around the same levels. Read More