
GLOBAL EQUITY MARKETS – July 22, 2023
REVIEW
The benchmark for the Global equity markets performance, the iShares MSCI All Country World Index ETF (ACWI.O) broke out of its multi-month long consolidation. Breakout above 93.3 levels is very positive for Global equities. The ETF is possibly completing two chart patterns at the same time, increasing conviction in the recent breakout. The ETF formed a month-long bullish pennant and with last week's strong move completed the bullish continuation chart pattern, targeting 101 levels possibly as the first objective. During any pullback strong support area remains between 93.3 and 96 levels.
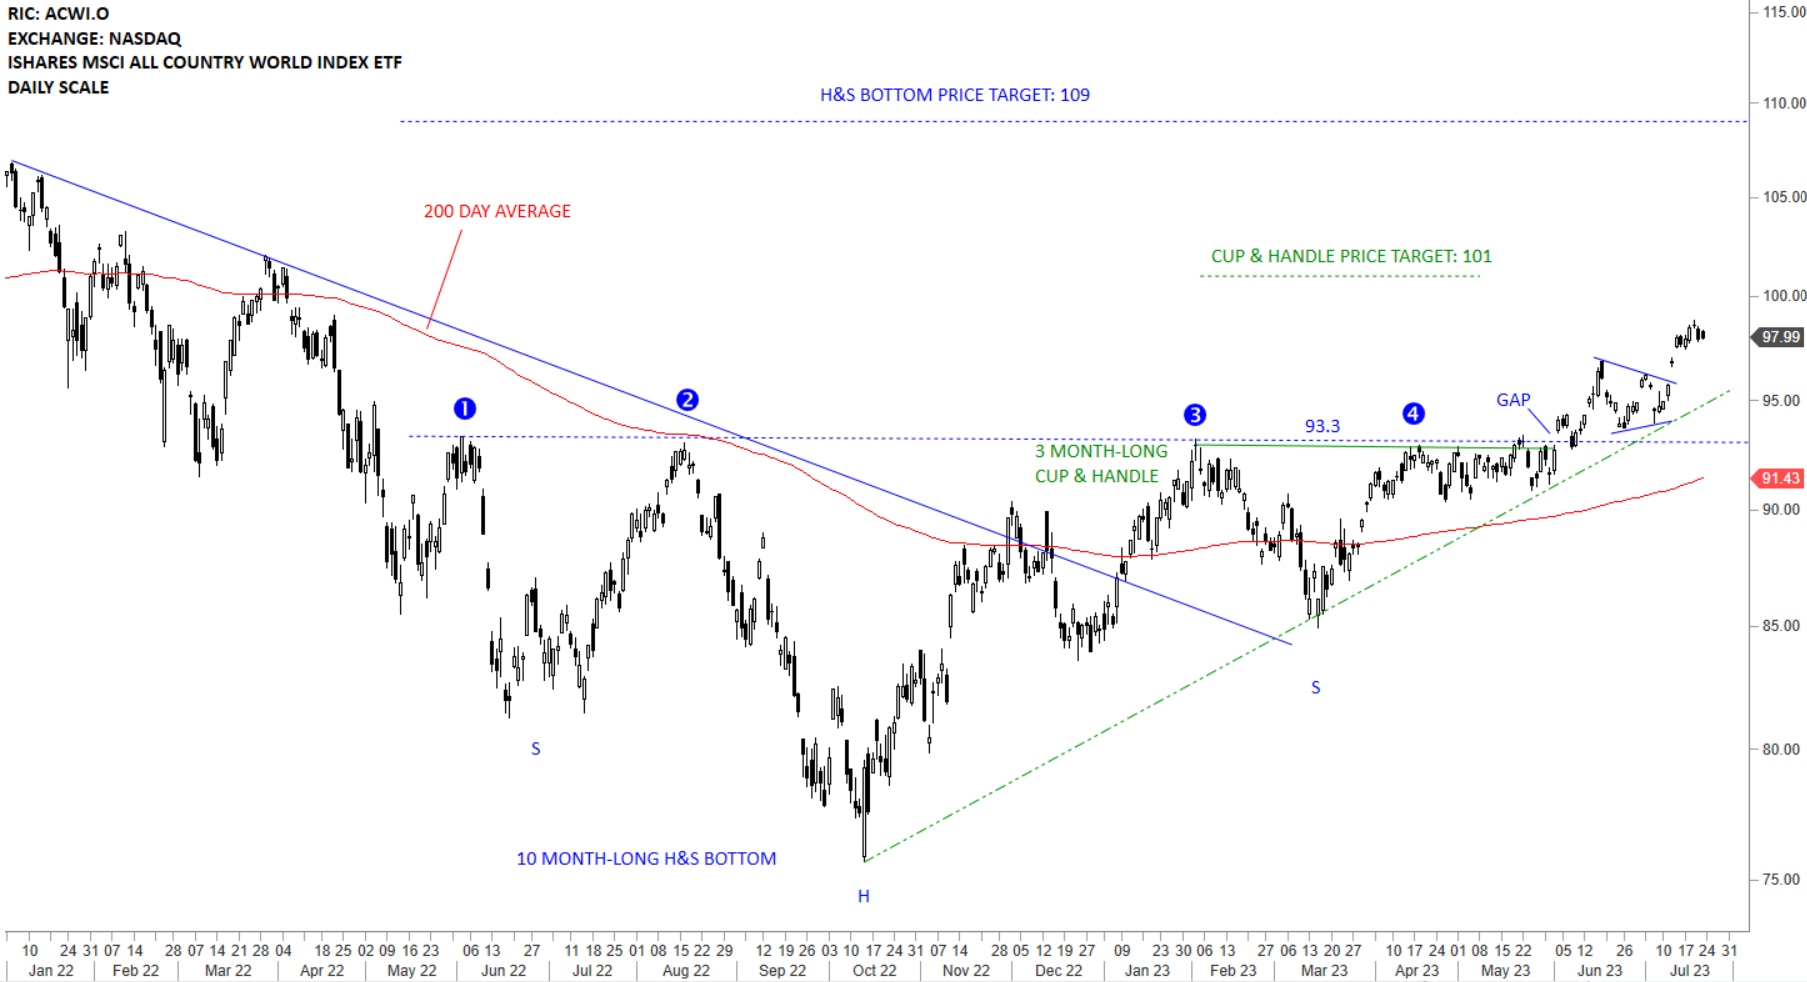 Read More
INTERIM UPDATE – July 21, 2023
I start my research on Mondays and finalize by end of day Thursday. Friday is dedicated to putting all ideas to the report format. During the week I come across good setups and those are featured in the weekly report. However, there are those that pop during the week and is worth bringing to your attention before the week finalizes. Below are the latest additions to Tech Charts watchlist. These charts will also be included in the weekly update.
Read More
GLOBAL EQUITY MARKETS – July 15, 2023
REVIEW
The benchmark for the Global equity markets performance, the iShares MSCI All Country World Index ETF (ACWI.O) broke out of its multi-month long consolidation. Breakout above 93.3 levels is very positive for Global equities. The ETF is possibly completing two chart patterns at the same time, increasing conviction in the recent breakout. The ETF formed a month-long bullish pennant and with this week's strong move completed the bullish continuation chart pattern, targeting 101 levels possibly as the first objective. During any pullback strong support area remains between 93.3 and 96 levels.
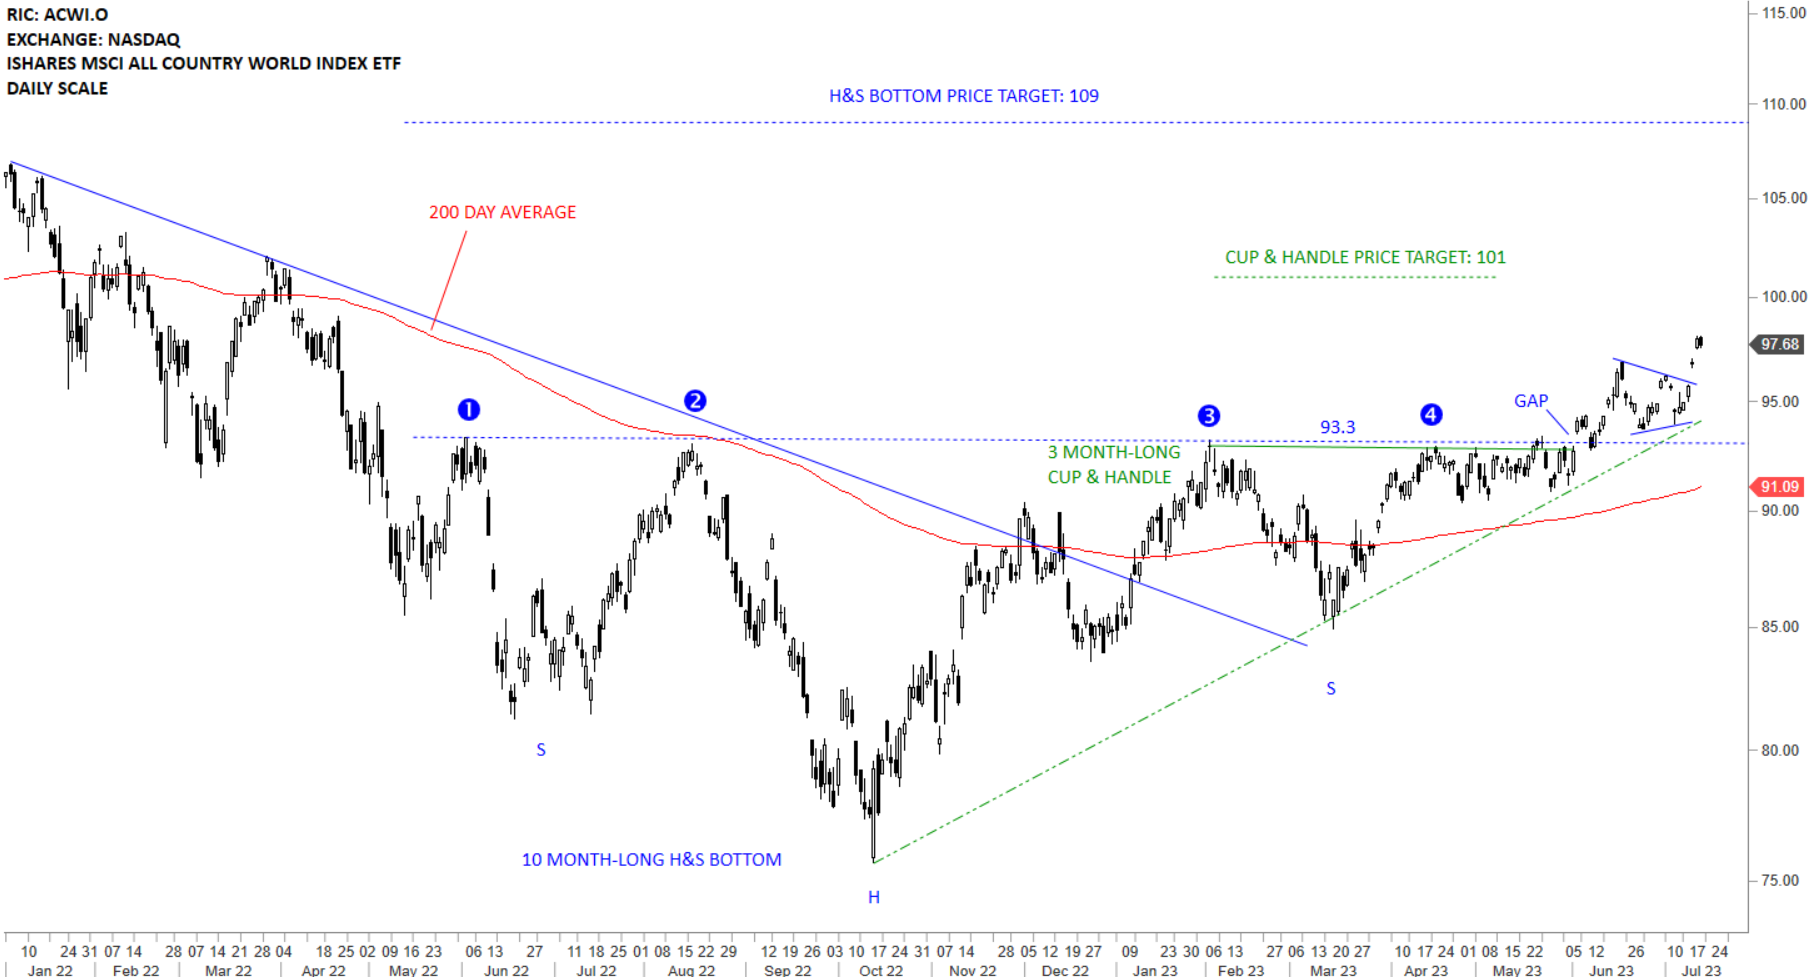 Read More
