
INTERIM UPDATE – October 17, 2023
During the weekend research and daily charts review I came across those text-book opportunities which I think are time sensitive. Below are the latest additions to Tech Charts watchlist. These charts will also be included in the weekly update.
Read More
CRYPTOCURRENCIES – October 15, 2023
Bullish outlook on BTCUSD remains intact. Important support level at 25K level. A re-test of 28K levels can increase the likelihood of a bottom reversal, possibly a double bottom. ETHUSD chart is possibly morphing with a possible short-term rectangle on daily scale price chart. Read More

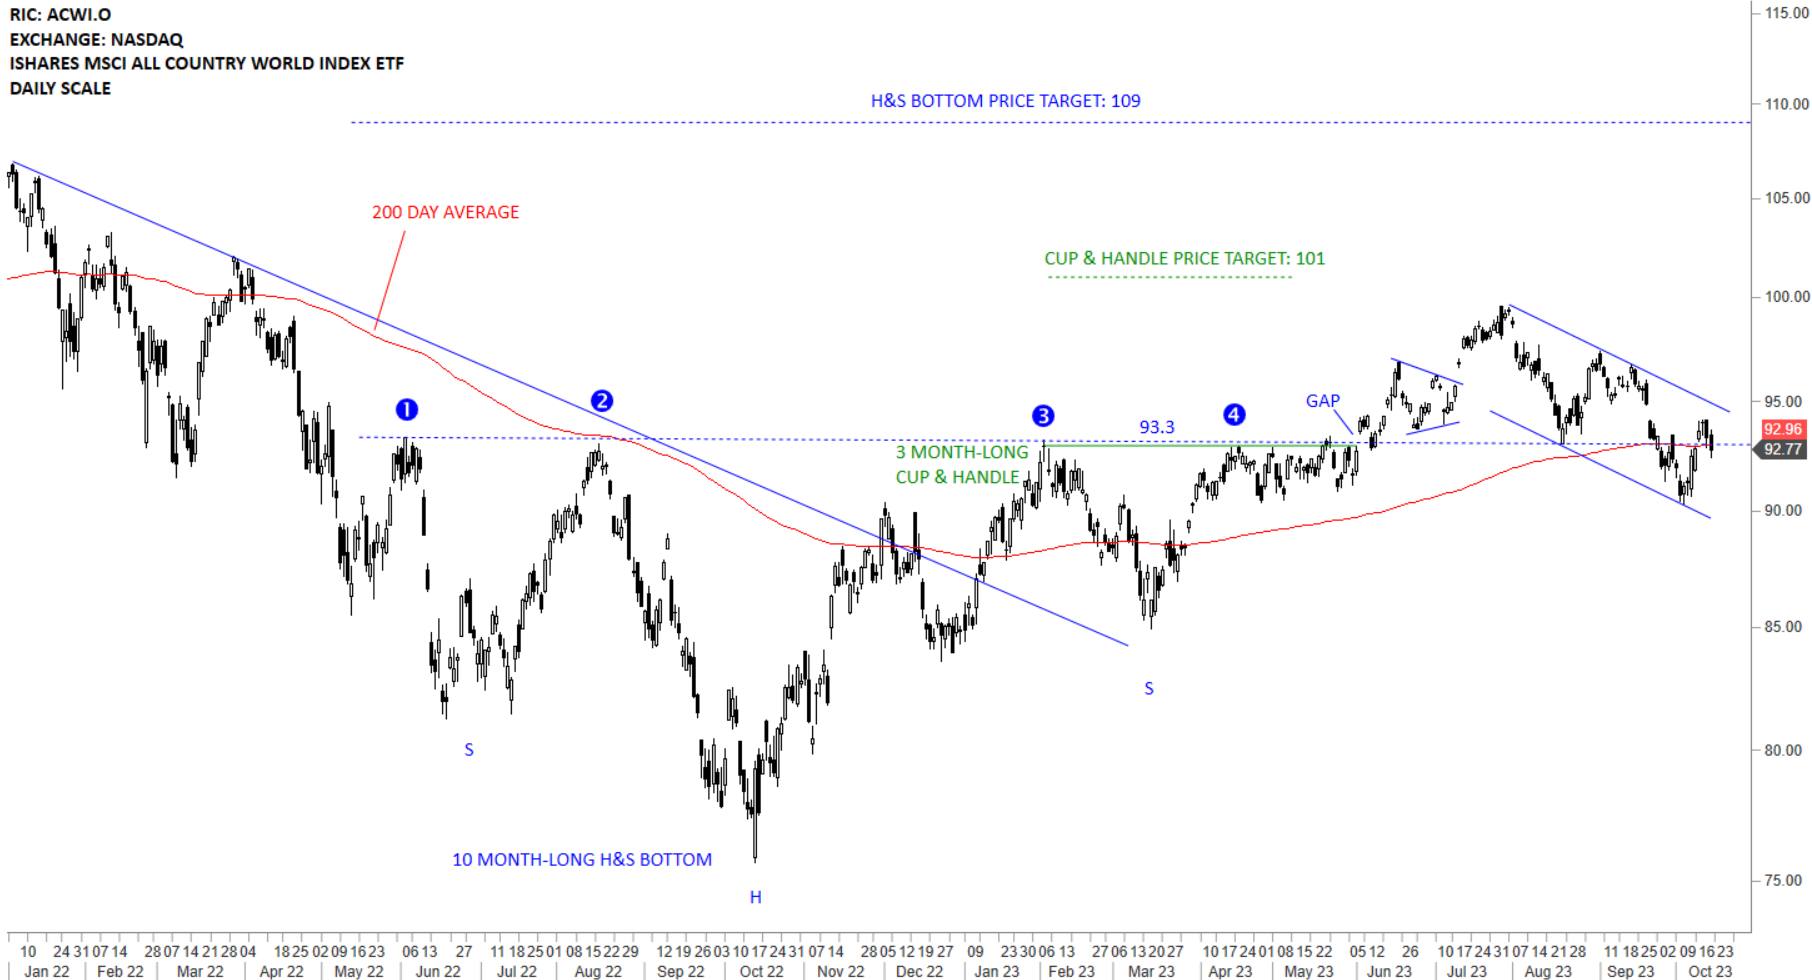
GLOBAL EQUITY MARKETS – October 14, 2023
REVIEW
The benchmark for the Global equity markets performance, the iShares MSCI All Country World Index ETF (ACWI.O) rebounded towards the resistance at 93 levels. Previous support at 93 levels become the new resistance. Failure to recover above 93 levels can result in further weakness below the long-term average. A sharp recovery above 93 levels can result in a bear trap and resume the uptrend on the Global Equity benchmark. For the uptrend to resume in Global Equities, it will be important for the ETF to stabilize above the long-term average.
 Read More
