
INTERIM UPDATE – May 9, 2024
I start my research on Mondays and finalize by end of day Thursday. Friday is dedicated to putting all ideas to the report format. During the week I come across good setups and those are featured in the weekly report. However, there are those that pop up during the week and is worth bringing to your attention before the week finalizes. Below are the latest additions to Tech Charts watchlist from U.S. equities. Gold single equities have been setting up nicely and the below opportunity can be a play on precious metals strength in coming weeks. These charts will be covered in the weekly report as well.
Read More
GLOBAL EQUITY MARKETS – May 4, 2024
REVIEW
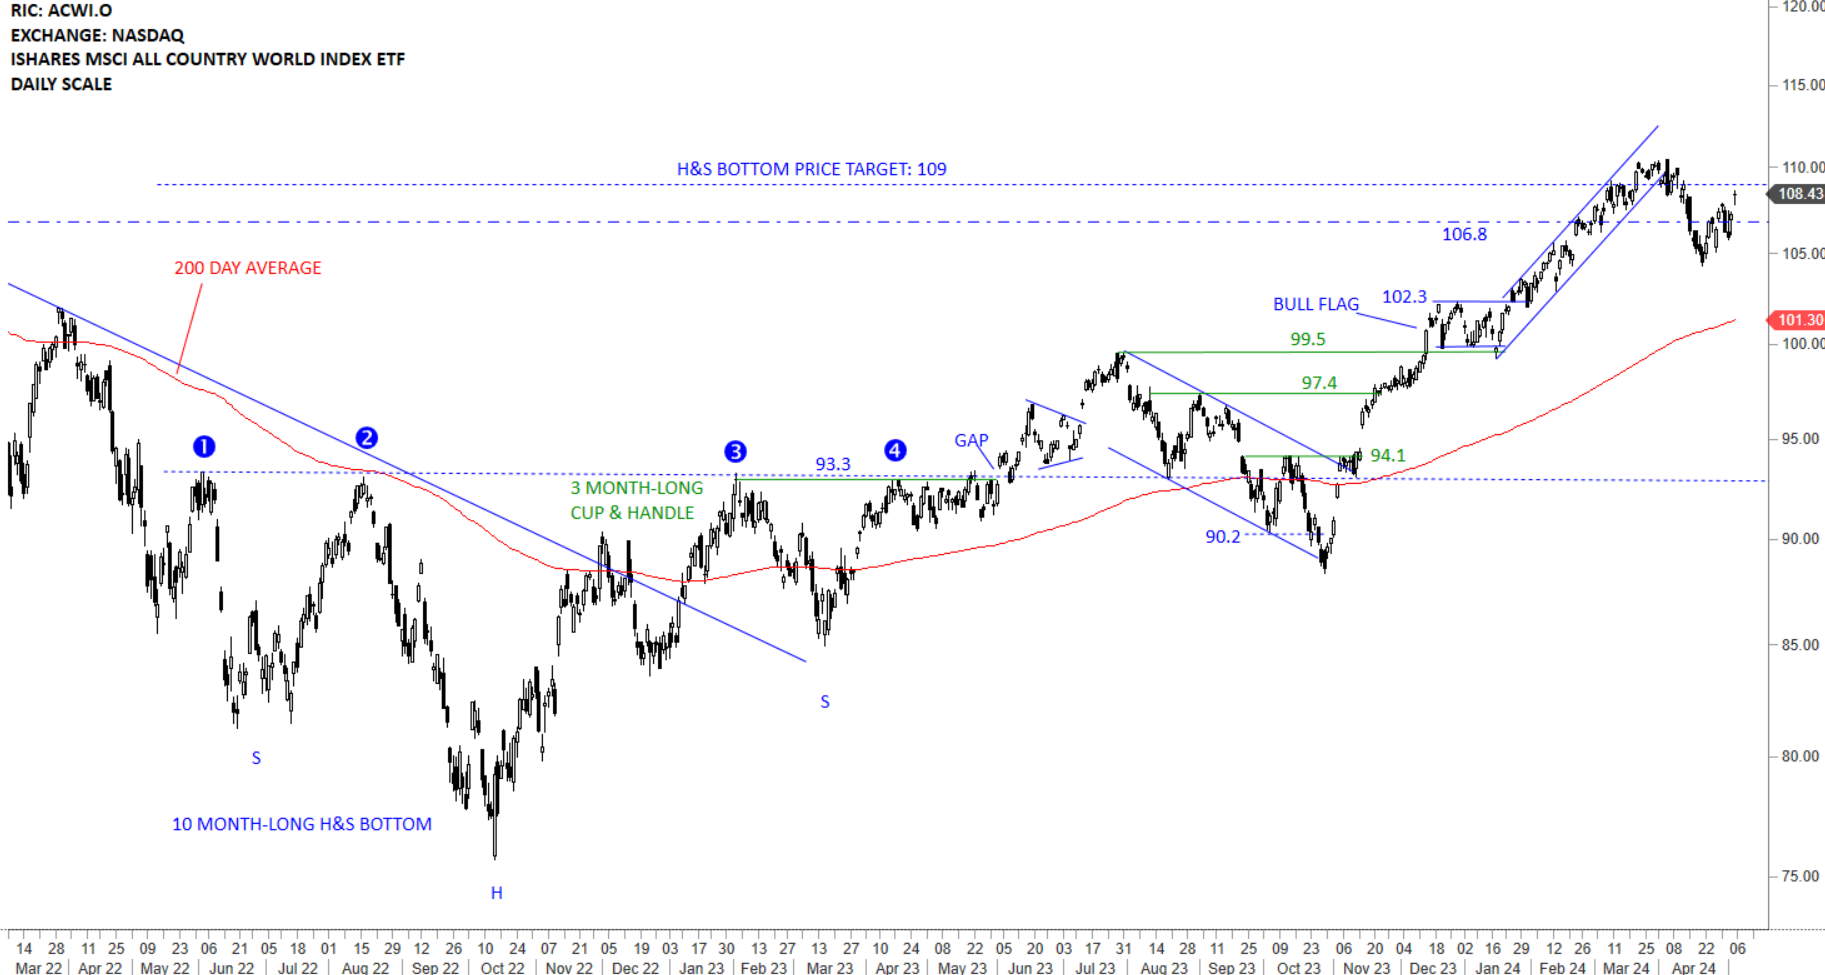
The benchmark for the Global equity markets performance, the iShares MSCI All Country World Index ETF (ACWI.O) reached its long-term H&S bottom price target at 109 levels. The ETF earlier completed a bullish flag which has helped the uptrend resume higher. The ETF breached the lower boundary of the short-term uptrend and this resulted in a pullback towards the support area between 106.8-102.3. Price is clearly above the long-term average and the uptrend is intact. Much deeper correction can target the 200-day average at 101.3 levels. Since October 2023, the index had a strong run and it is totally normal to see consolidation of earlier gains above the long-term average.
 Read More
CRYPTOCURRENCIES – April 28, 2024
BTCUSD is consolidating earlier gains below the strong resistance area between 65K - 68K. Breakout above the upper boundary of a rising trend channel started a runaway price movement towards the resistance area. This week's price action is resuming the sideways consolidation. This can be a preparation for a breakout to all-time highs. ETHUSD cleared the upper boundary of the possible rising wedge, held the support level and resumed higher with long back to back white candles towards the next resistance at 4,400 levels. Recent pullback found support above 2,800 levels. Uptrend can resume. Read More

