
GLOBAL EQUITY MARKETS – June 1, 2024
REVIEW
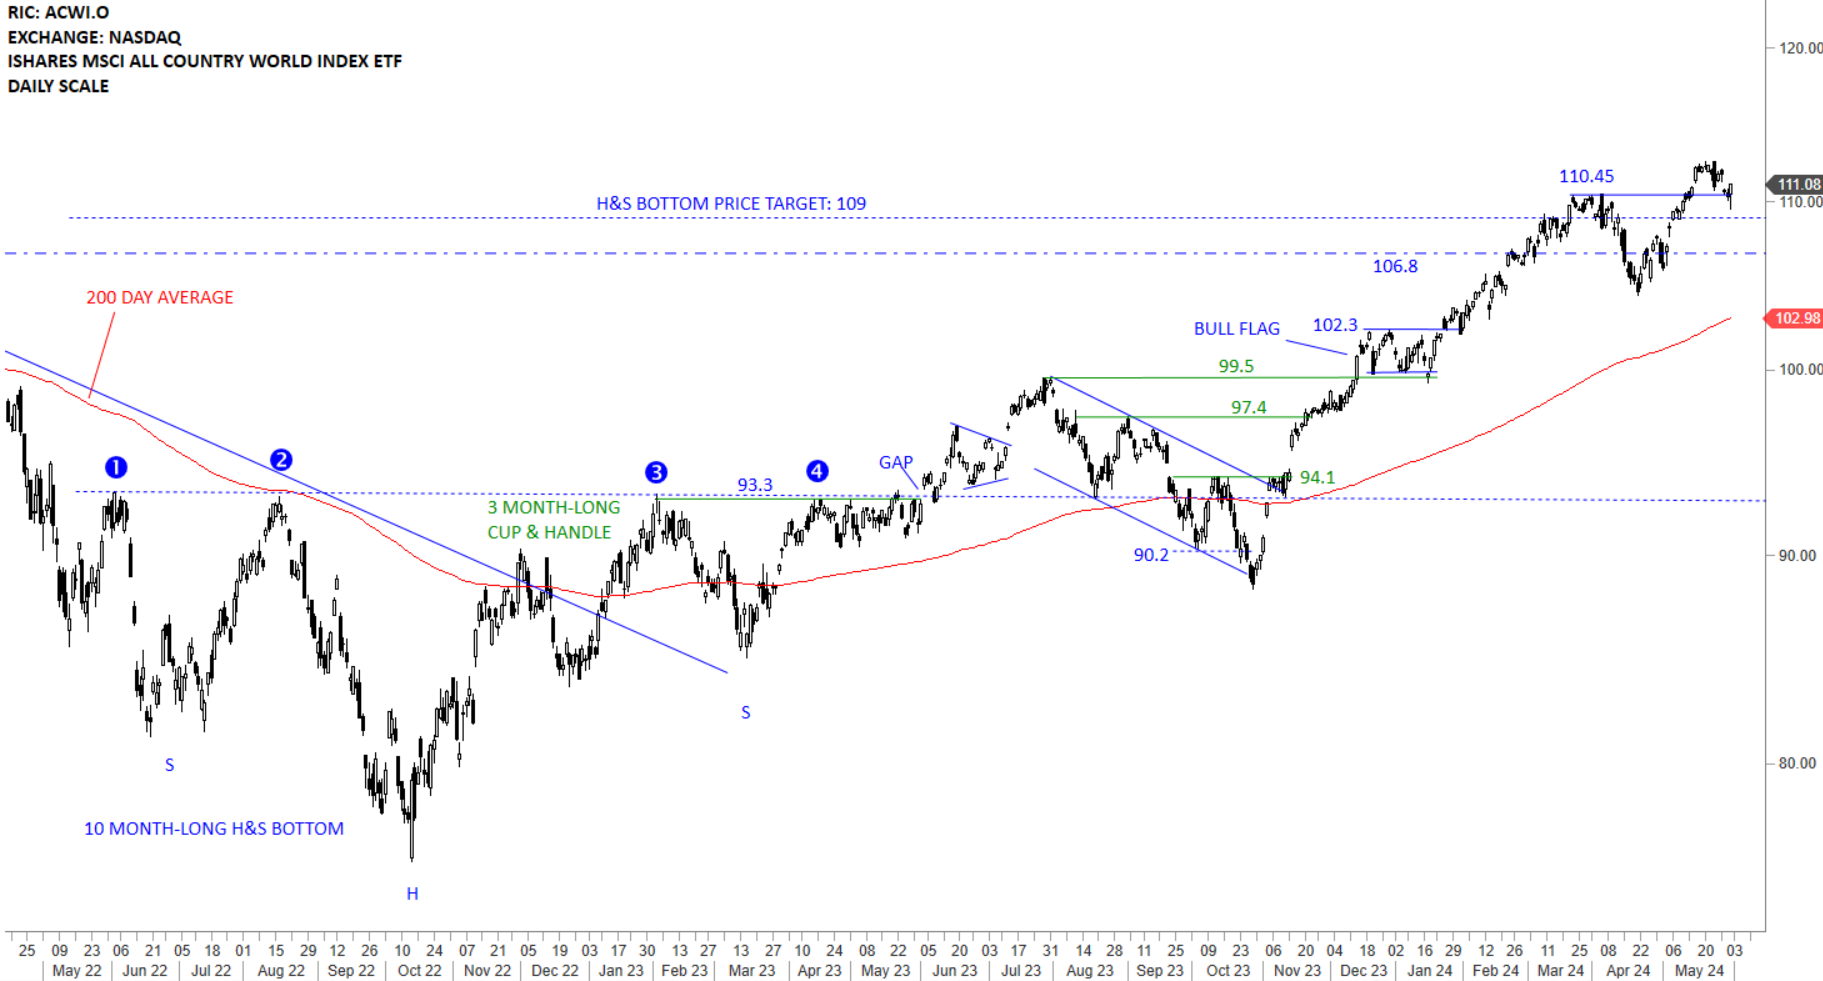
The benchmark for the Global equity markets performance, the iShares MSCI All Country World Index ETF (ACWI.O) reached its long-term H&S bottom price target at 109 levels. Price is clearly above the long-term average and the uptrend is intact. The ETF with this increased volatility pulled back to its minor high at 110.45 levels. 110.45 levels becomes the short-term support. A wider support area is between 106.8 and 110.45 levels. There is no top reversal chart pattern on daily or weekly scale price charts. Given the Friday's rebound from the support at 110.45 levels, I continue to analyze the ACWI ETF with bullish perspective.
 Read More
CRYPTOCURRENCIES – May 26, 2024
BTCUSD is consolidating earlier gains below the strong resistance area between 65K - 68K. Breakout above the upper boundary of a rising trend channel started a runaway price movement towards the resistance area. 60K continues to be an important support and an inflection point. ETHUSD had a sharp rebound from 2,800 levels and kept the uptrend intact. ETHBTC chart rebounded from strong support area. Monitoring the pair for the month of May close. A strong close at current levels can reinitiate the trading range between 0.05 and 0.08 levels. Read More

GLOBAL EQUITY MARKETS – May 25, 2024
REVIEW
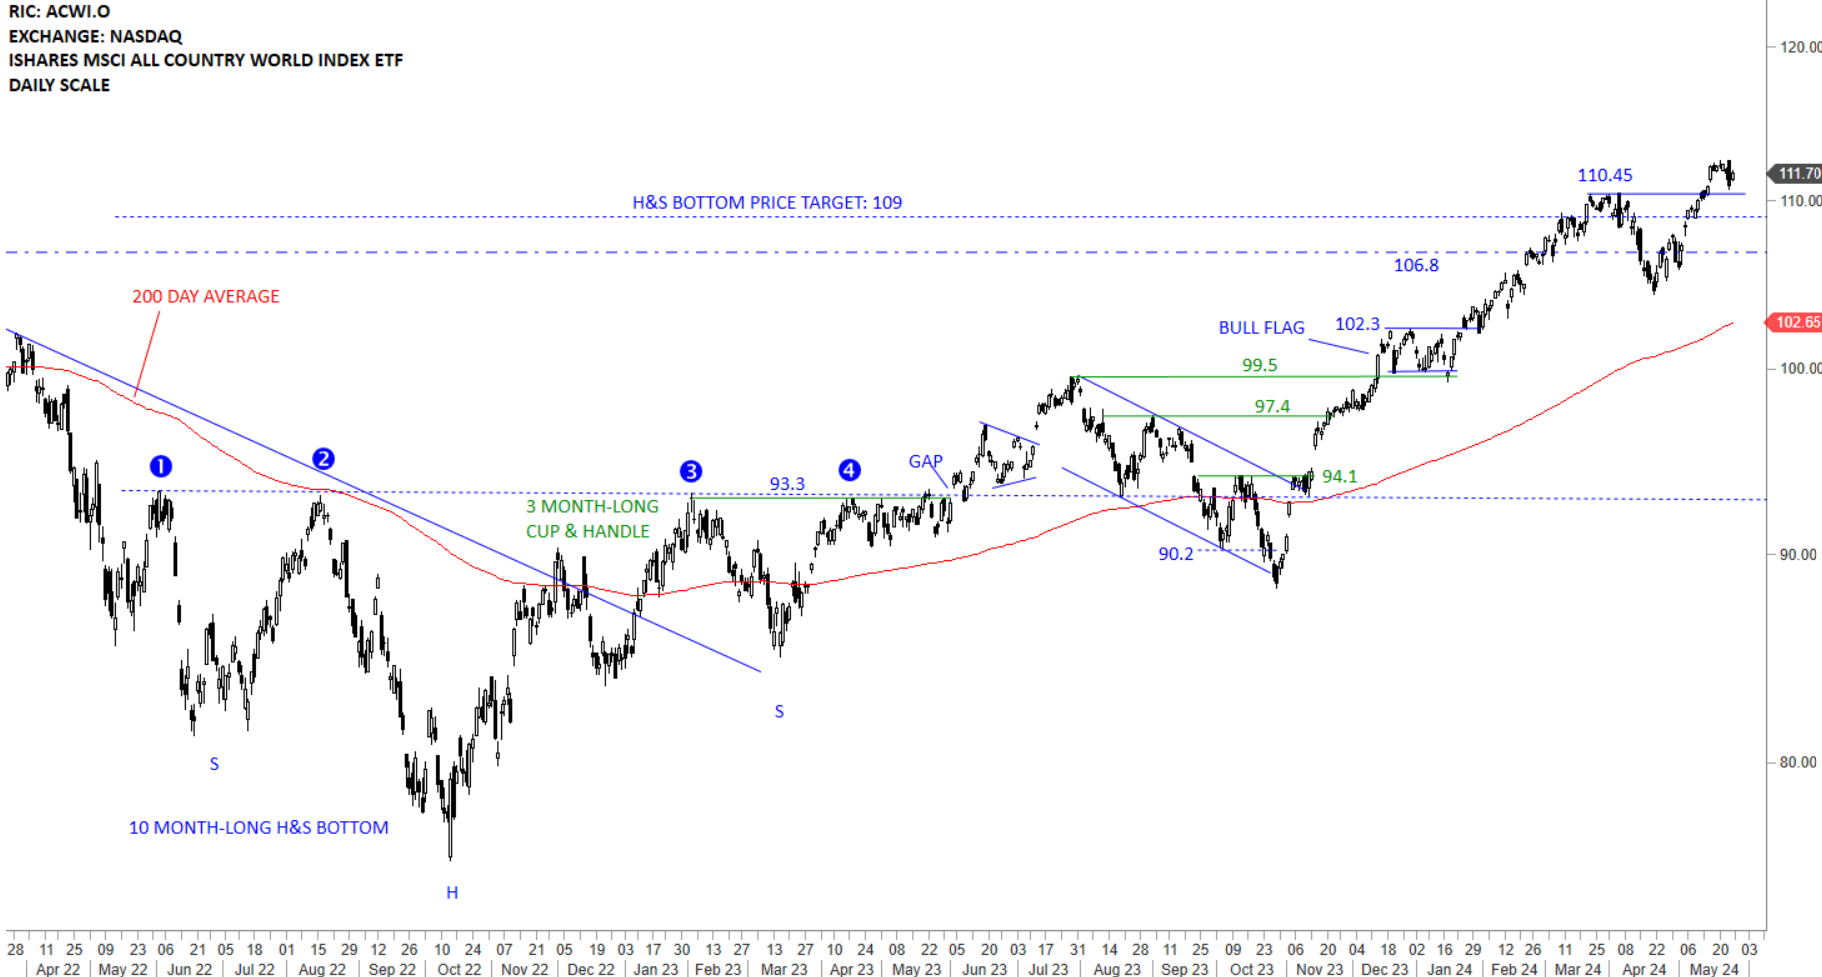
The benchmark for the Global equity markets performance, the iShares MSCI All Country World Index ETF (ACWI.O) reached its long-term H&S bottom price target at 109 levels. Price is clearly above the long-term average and the uptrend is intact. The ETF with this increased volatility pulled back to its minor high at 110.45 levels. 110.45 levels becomes the short-term support. A wider support area is between 106.8 and 110.45 levels. There is no top reversal chart pattern on daily or weekly scale price charts. If price manages to hold above 110.45 levels in the short-term, I will view this as positive and expect the continuation of the existing uptrend.
 Read More
