
INTERIM UPDATE – June 12, 2024
I start my research on Mondays and finalize by end of day Thursday. Friday is dedicated to putting all ideas to the report format. During the week I come across good setups and those are featured in the weekly report. However, there are those that pop up during the week and is worth bringing to your attention before the week finalizes. Below are the latest additions to Tech Charts watchlist from different regions in single equities. These charts will be covered in the weekly report as well.
Read More
CRYPTOCURRENCIES – June 9, 2024
BTCUSD is consolidating earlier gains below the strong resistance area between 65K - 68K. Breakout above the upper boundary of a rising trend channel started a runaway price movement towards the resistance area. 60K continues to be an important support and an inflection point. ETHUSD had a sharp rebound from 2,800 levels and kept the uptrend intact. Price might be forming a possible cup & handle continuation. ETHBTC chart rebounded from strong support area. Strong monthly close in May kept the trading range between 0.05 and 0.08 levels. Read More

GLOBAL EQUITY MARKETS – June 8, 2024
REVIEW
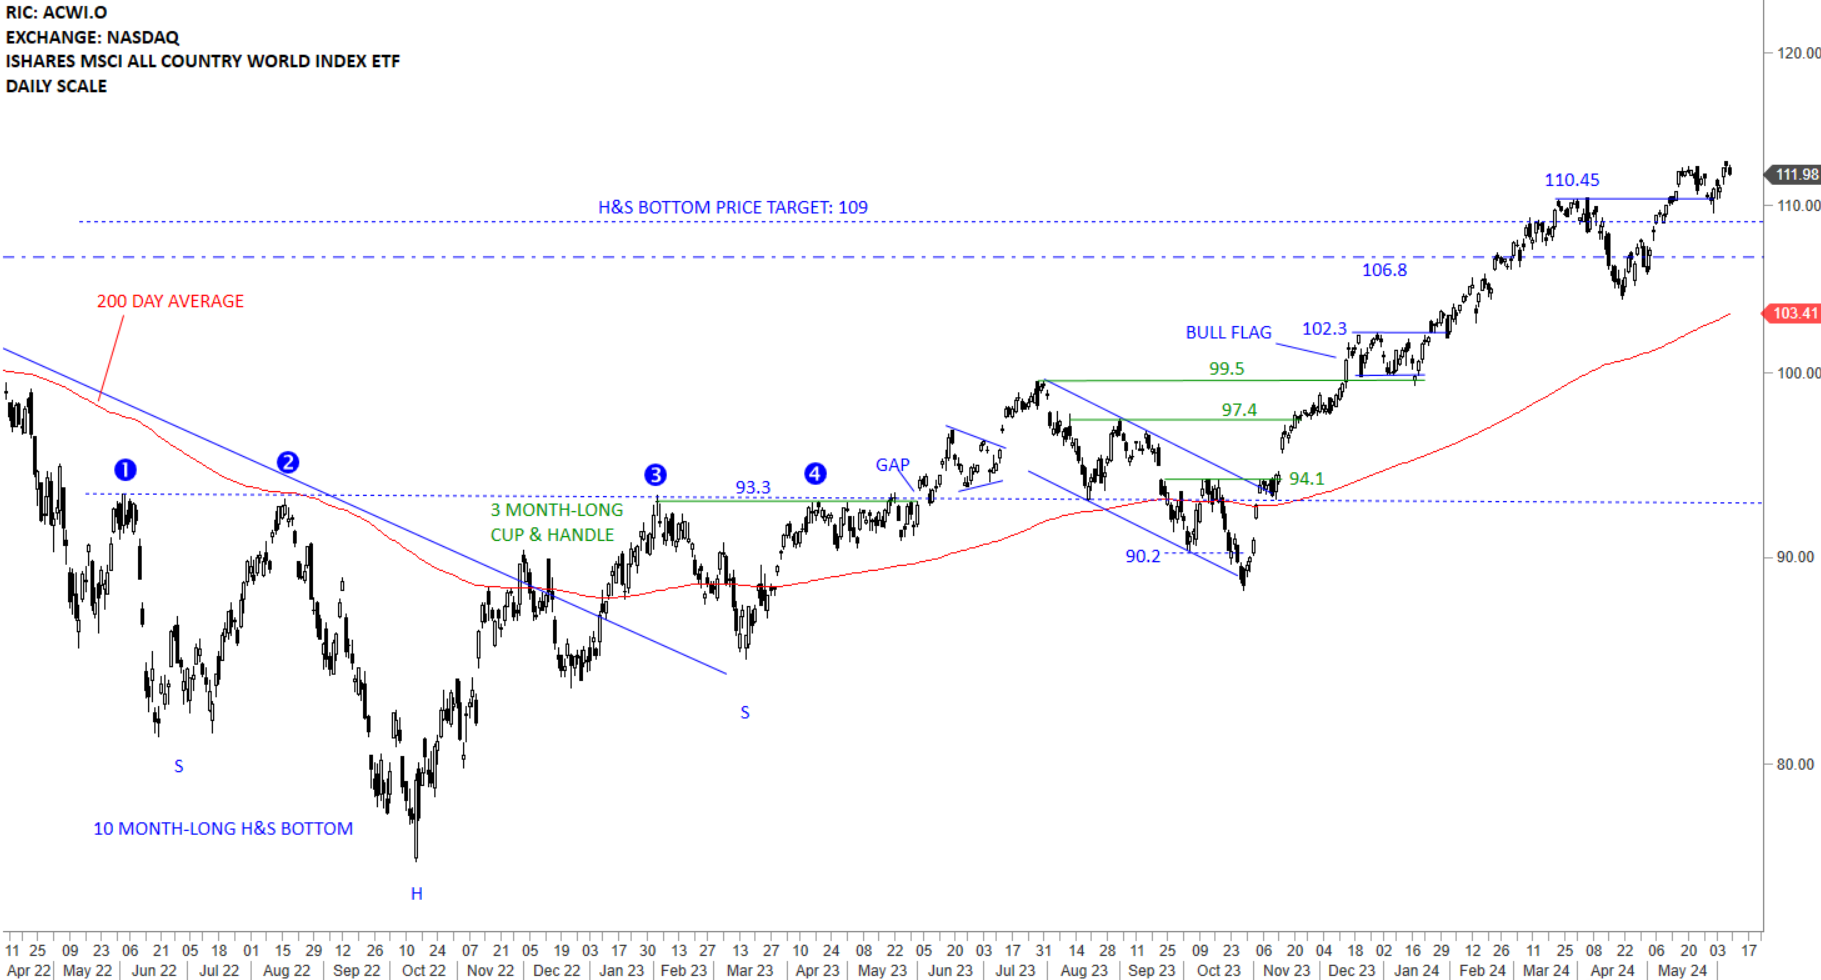
The benchmark for the Global equity markets performance, the iShares MSCI All Country World Index ETF (ACWI.O) reached its long-term H&S bottom price target at 109 levels. Price is clearly above the long-term average and the uptrend is intact. The ETF re-tested and rebounded from its minor high at 110.45 levels. 110.45 levels becomes the short-term support. A wider support area is between 106.8 and 110.45 levels. There is no top reversal chart pattern on daily or weekly scale price charts.
 Read More
