
CRYPTOCURRENCIES – July 7, 2024
BTCUSD broke down support at 60K. Previous support becomes the new resistance. Price is still above the year-long average and should be considered to be in an uptrend. ETHUSD re-tests the support at 2,800 levels. Possible rectangle with both boundaries well-defined. ETHBTC chart rebounded from strong support area. Strong monthly close in May kept the trading range between 0.05 and 0.08 levels. Read More

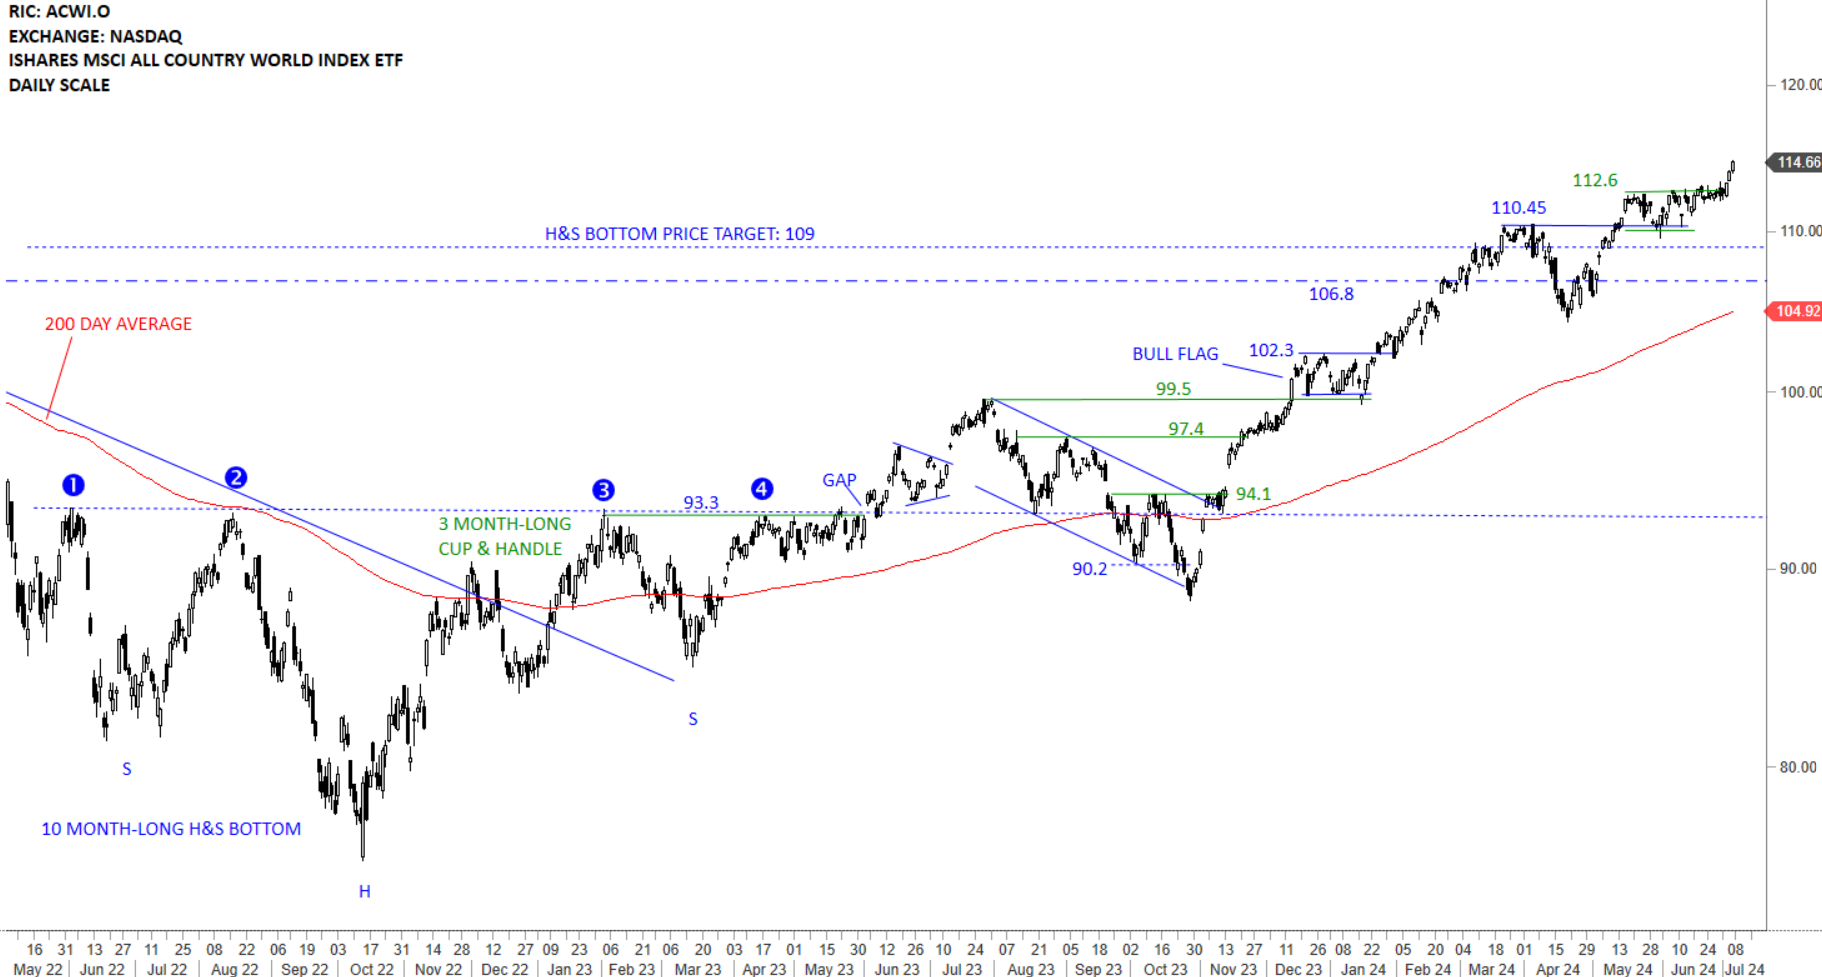
GLOBAL EQUITY MARKETS – July 6, 2024
REVIEW
The benchmark for the Global equity markets performance, the iShares MSCI All Country World Index ETF (ACWI.O) is clearly above its long-term average and resuming the steady uptrend. 112.6 levels becomes the short-term support after the ETF completed the one month-long bullish flag forming between 110.45 and 112.6 levels. Breakout is now resuming the uptrend. Bullish flag price target is around 120 levels. Strong support area is between 110.45 and 112.6 levels.
 Read More
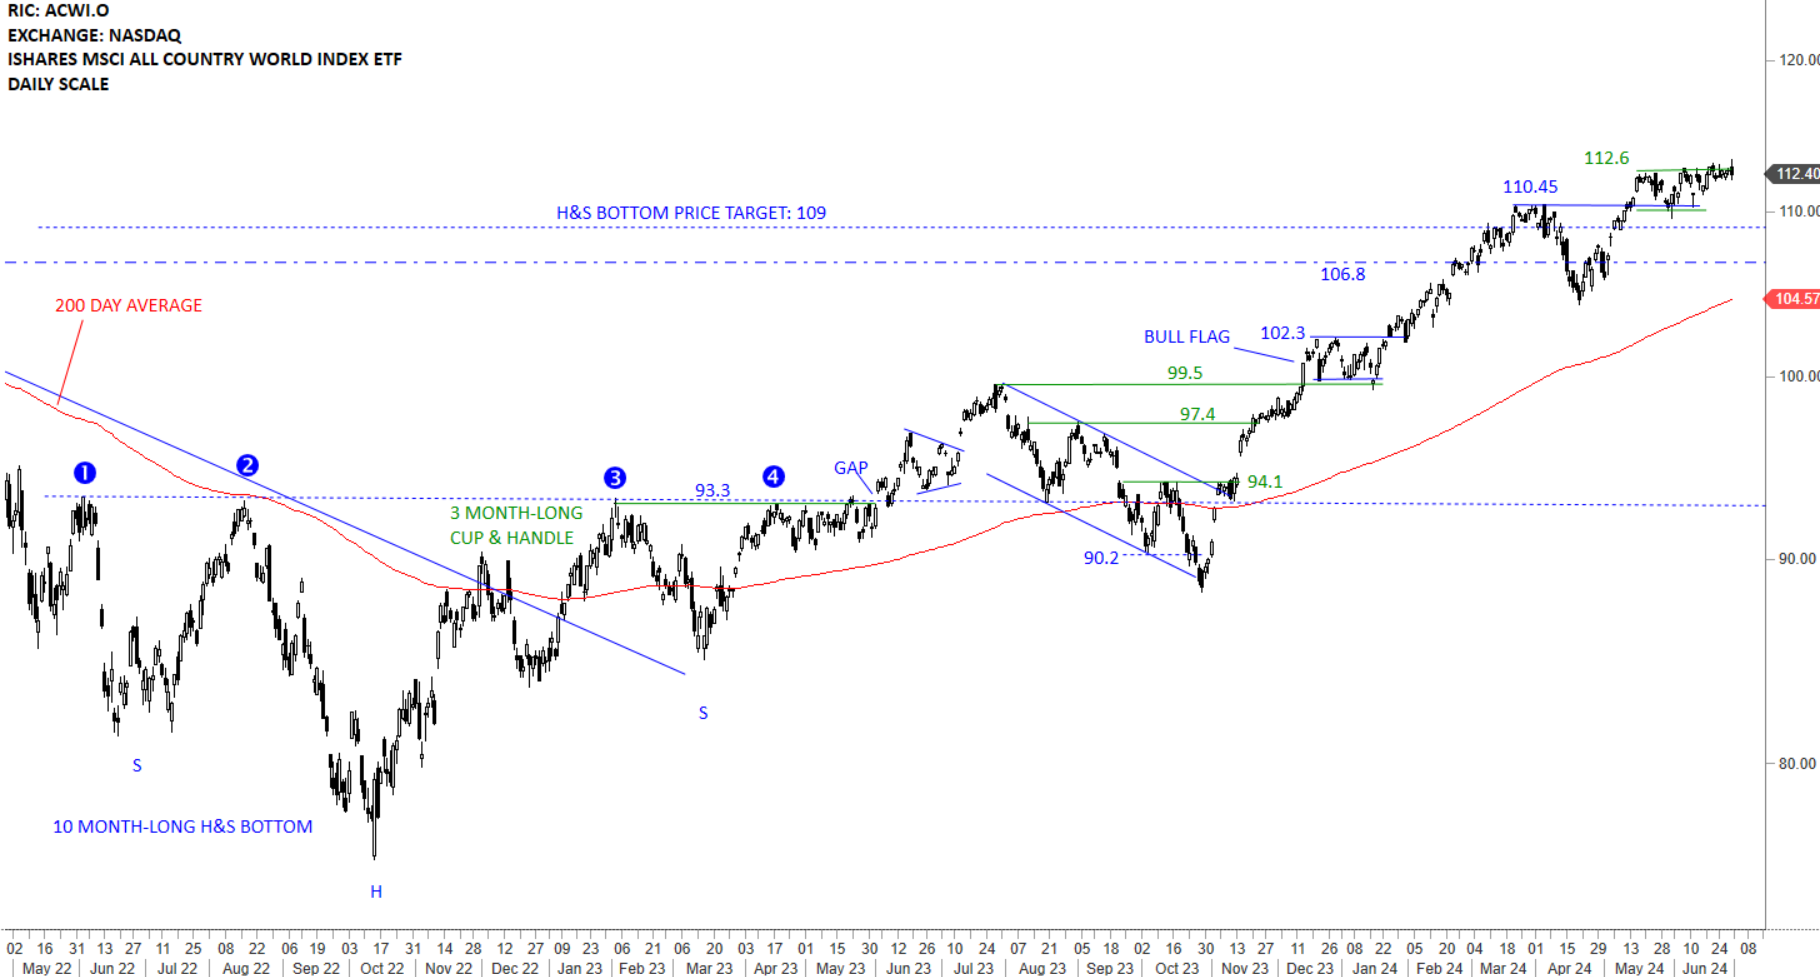
GLOBAL EQUITY MARKETS – June 29, 2024
REVIEW
The benchmark for the Global equity markets performance, the iShares MSCI All Country World Index ETF (ACWI.O) reached its long-term H&S bottom price target at 109 levels. Price is clearly above the long-term average and the uptrend is intact. 110.45 levels becomes the short-term support. A wider support area is between 106.8 and 110.45 levels. There is a possibility of a one month-long bullish flag forming between 110.45 and 112.6 levels. Breakout can resume the uptrend. Failure to hold above 110.45 levels can result in a pullback towards the 200-day average around 104.16 levels. Bullish flag price target is around 120 levels.
 Read More
