
CRYPTOCURRENCIES – July 21, 2024
BTCUSD quickly recovered above 60K. Emphasizing the importance of focusing on the longer-term uptrend. Price is still above the year-long average and should be considered to be in an uptrend. ETHUSD re-tests the support at 2,800 levels. Possible rectangle with both boundaries well-defined. ETHBTC chart rebounded from strong support area. Strong monthly close in May kept the trading range between 0.05 and 0.08 levels. Read More
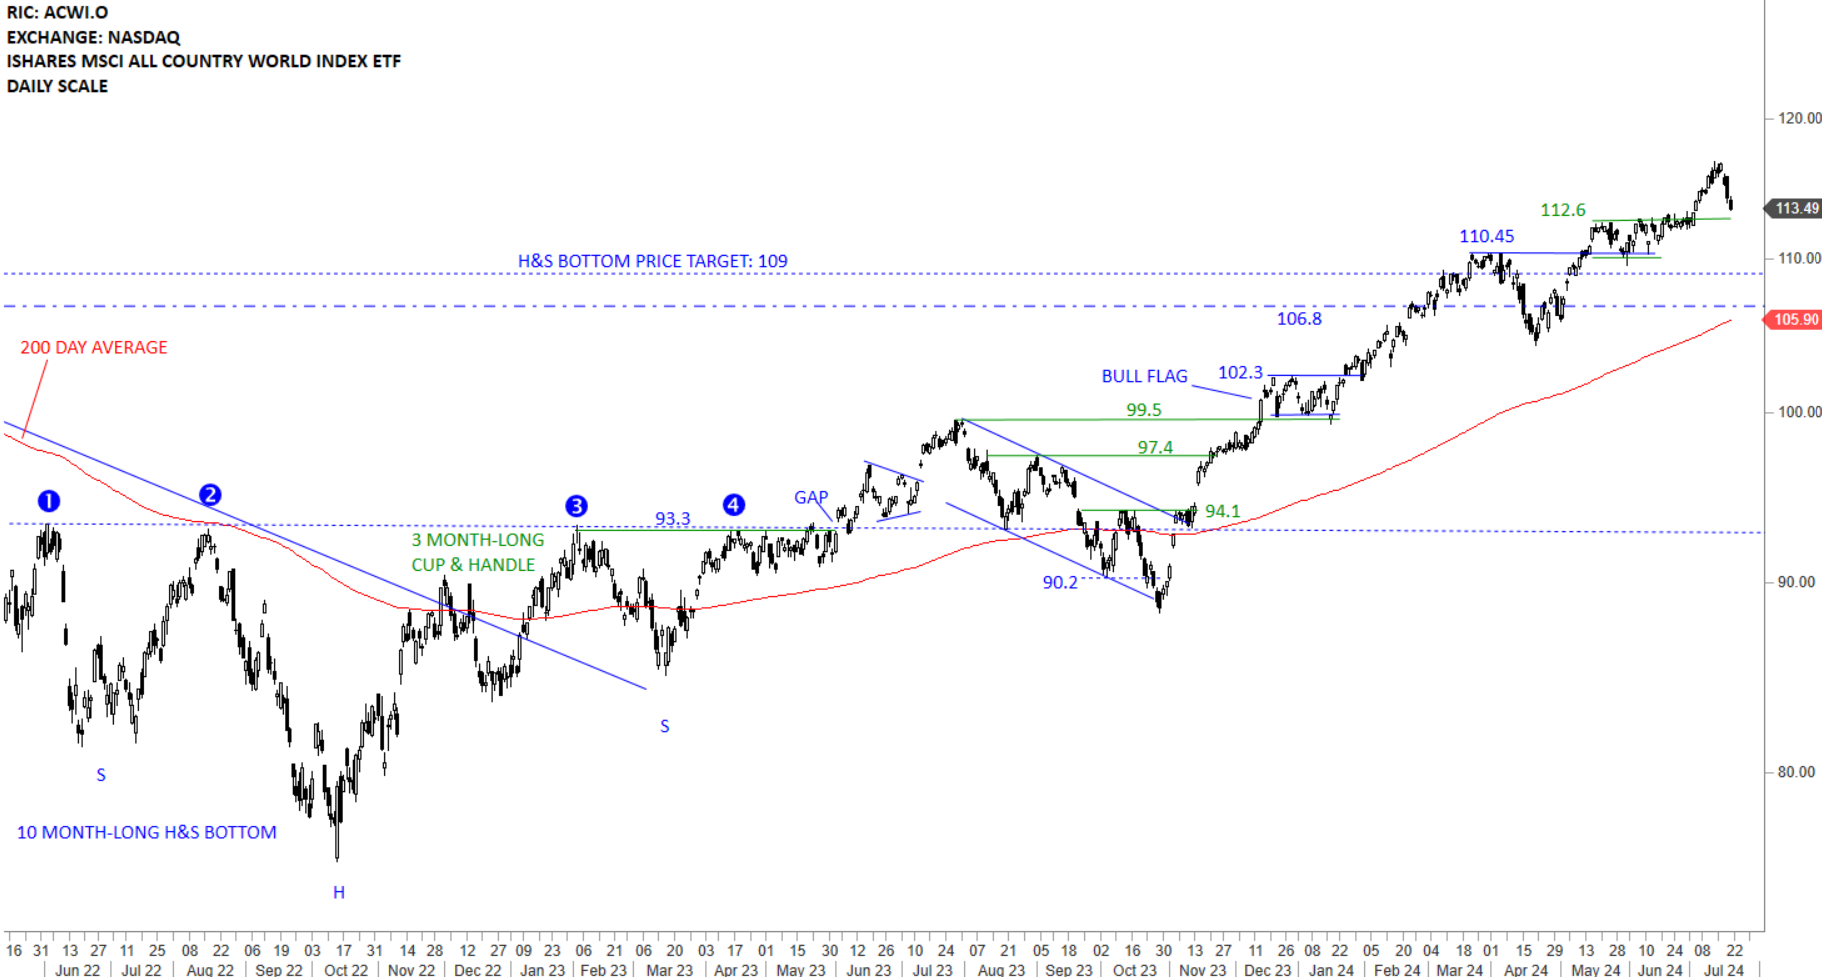
GLOBAL EQUITY MARKETS – July 20, 2024
REVIEW
The benchmark for the Global equity markets performance, the iShares MSCI All Country World Index ETF (ACWI.O) is clearly above its long-term average and resuming the steady uptrend. 112.6 levels becomes the short-term support after the ETF had a strong run following the breakout from one month-long bullish flag. Bullish flag price target is around 120 levels. Strong support area is between 110.45 and 112.6 levels. Short-term corrections and consolidations are part of any strong uptrend and should be expected with this ETF as well. Larger-scale correction can target the 200-day average around 105.90 levels.
 Read More
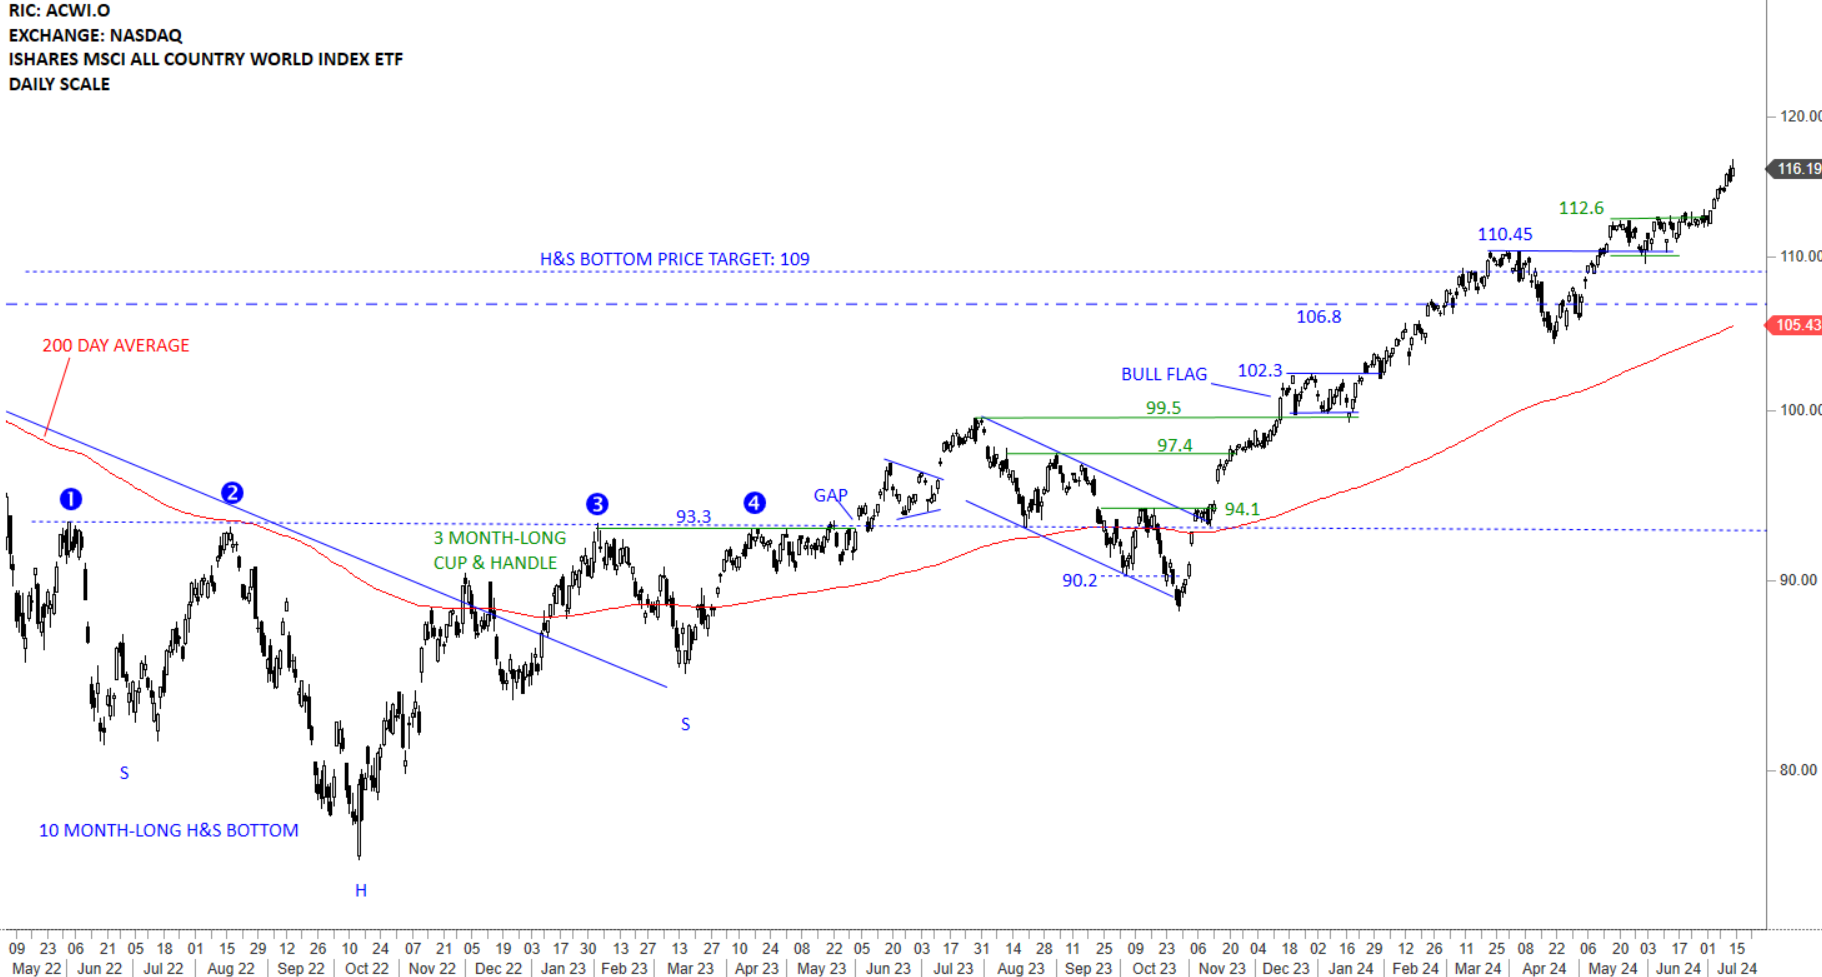
GLOBAL EQUITY MARKETS – July 13, 2024
REVIEW
The benchmark for the Global equity markets performance, the iShares MSCI All Country World Index ETF (ACWI.O) is clearly above its long-term average and resuming the steady uptrend. 112.6 levels becomes the short-term support after the ETF completed the one month-long bullish flag forming between 110.45 and 112.6 levels. Bullish flag price target is around 120 levels. Strong support area is between 110.45 and 112.6 levels. Short-term corrections and consolidations are part of any strong uptrend and should be expected with this ETF as well.
 Read More
