
GLOBAL EQUITY MARKETS – October 5, 2024
REVIEW
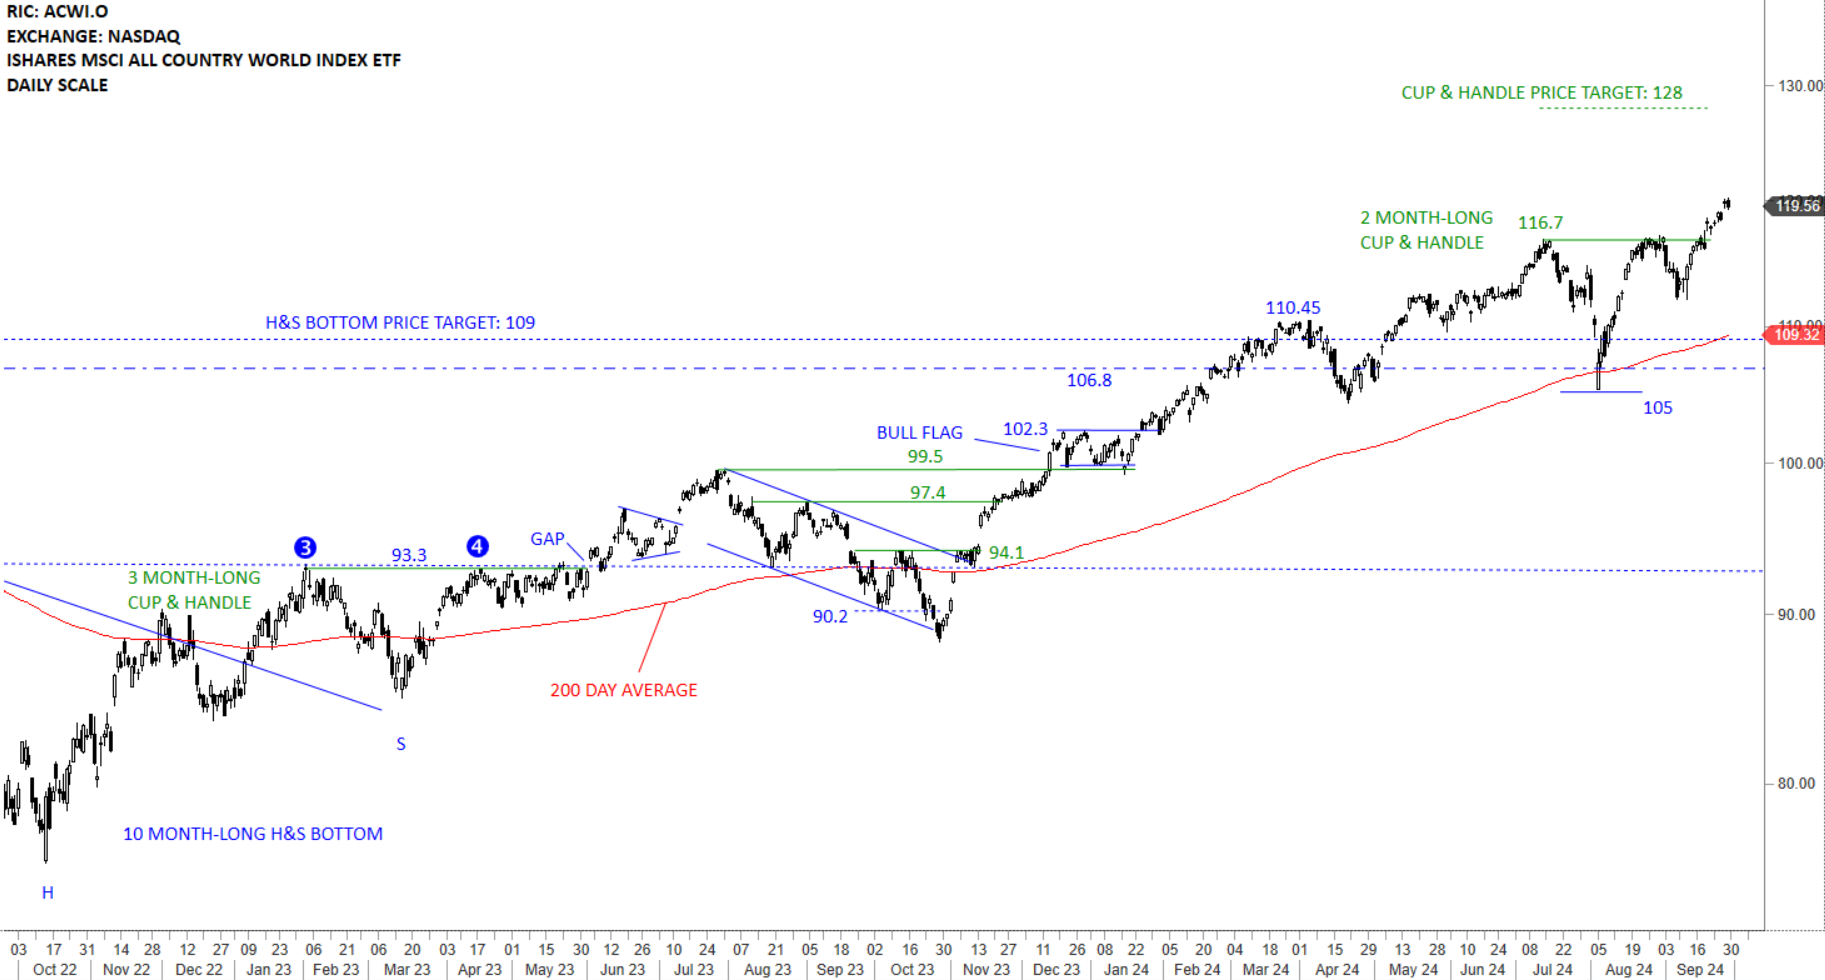
The benchmark for the Global equity markets performance, the iShares MSCI All Country World Index ETF (ACWI.O) cleared the horizontal resistance at 116.7 levels and possibly completed a 2 month-long cup & handle continuation with a price target of 128 levels. Strong support area for ACWI ETF is between 110.45 and 109.8. Short-term support is the horizontal pattern boundary at 116.7 levels. Uptrend is intact. The ETF can experience short-term setbacks.
 Read More
CRYPTOCURRENCIES – September 29, 2024
BTCUSD holding the year-long (52 week) average. Price is still above the year-long average and should be considered to be in an uptrend. A re-test of 73.7K will be very bullish for the pair. ETHUSD is having difficulty below its support at 2,800 levels. ETHBTC slipped below support at 0.05 levels. Breakdown below the horizontal support is resulting in ETH underperformance. Read More

GLOBAL EQUITY MARKETS – September 28, 2024
REVIEW
The benchmark for the Global equity markets performance, the iShares MSCI All Country World Index ETF (ACWI.O) cleared the horizontal resistance at 116.7 levels and possibly completed a 2 month-long cup & handle continuation with a price target of 128 levels. Strong support area for ACWI ETF is between 110.45 and 108.83. Short-term support is the horizontal pattern boundary at 116.7 levels. Uptrend is intact. The ETF can experience short-term setbacks.
 Read More
