
GLOBAL EQUITY MARKETS – January 18, 2025
REVIEW
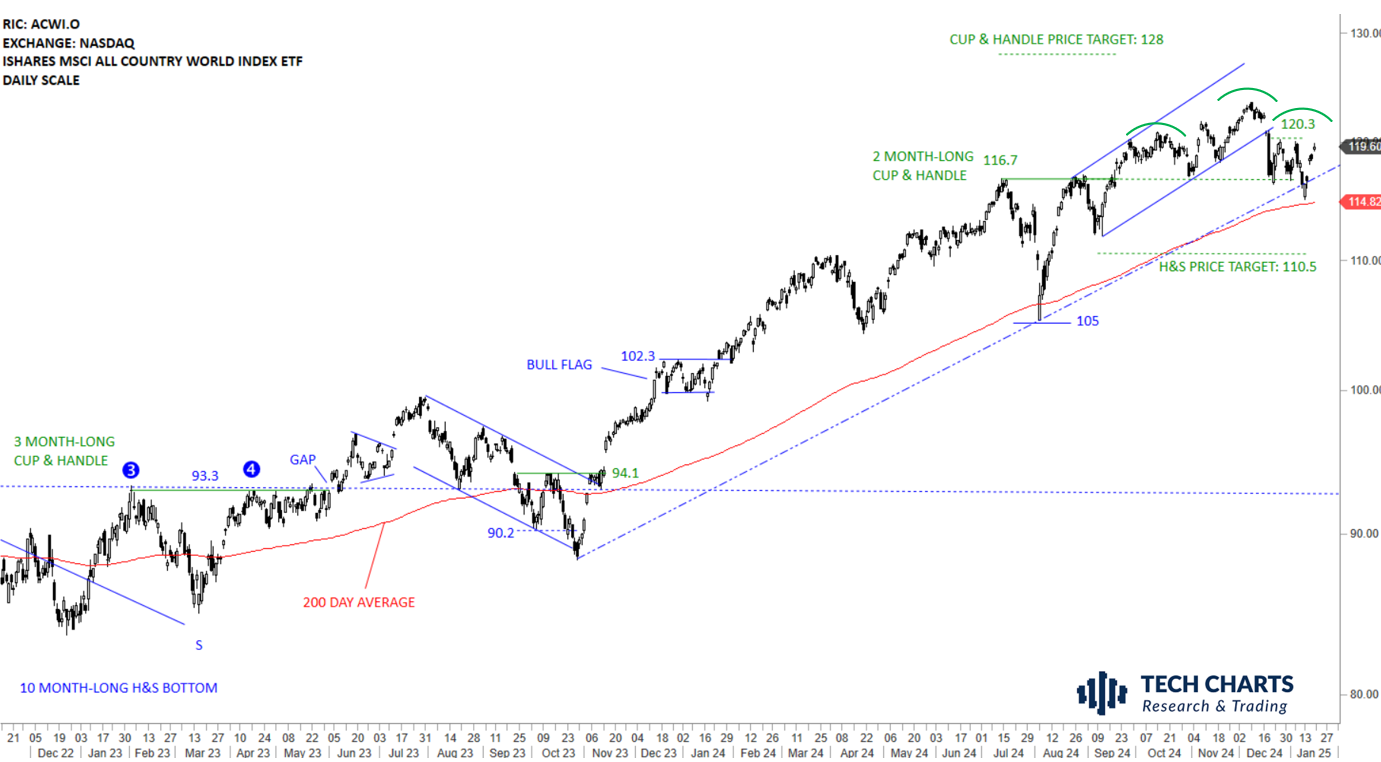
The benchmark for the Global equity markets performance, the iShares MSCI All Country World Index ETF (ACWI.O) rebounded strongly from support area between 114.6 and 116.7. One possibility is the developing H&S top if the support area is broken down. A breach above 120.3 levels can result in a H&S top failure and resume the uptrend. Breakdown of the support area (I would like to see a decisive close below the 200-day average to confirm the H&S top) can target 110.5 levels. For now price action looks like a reversion to mean similar to Aug 24. Continued consolidation above the year-long average can be a preparation for breakout higher.
 Read More
GLOBAL EQUITY MARKETS – January 11, 2025
REVIEW
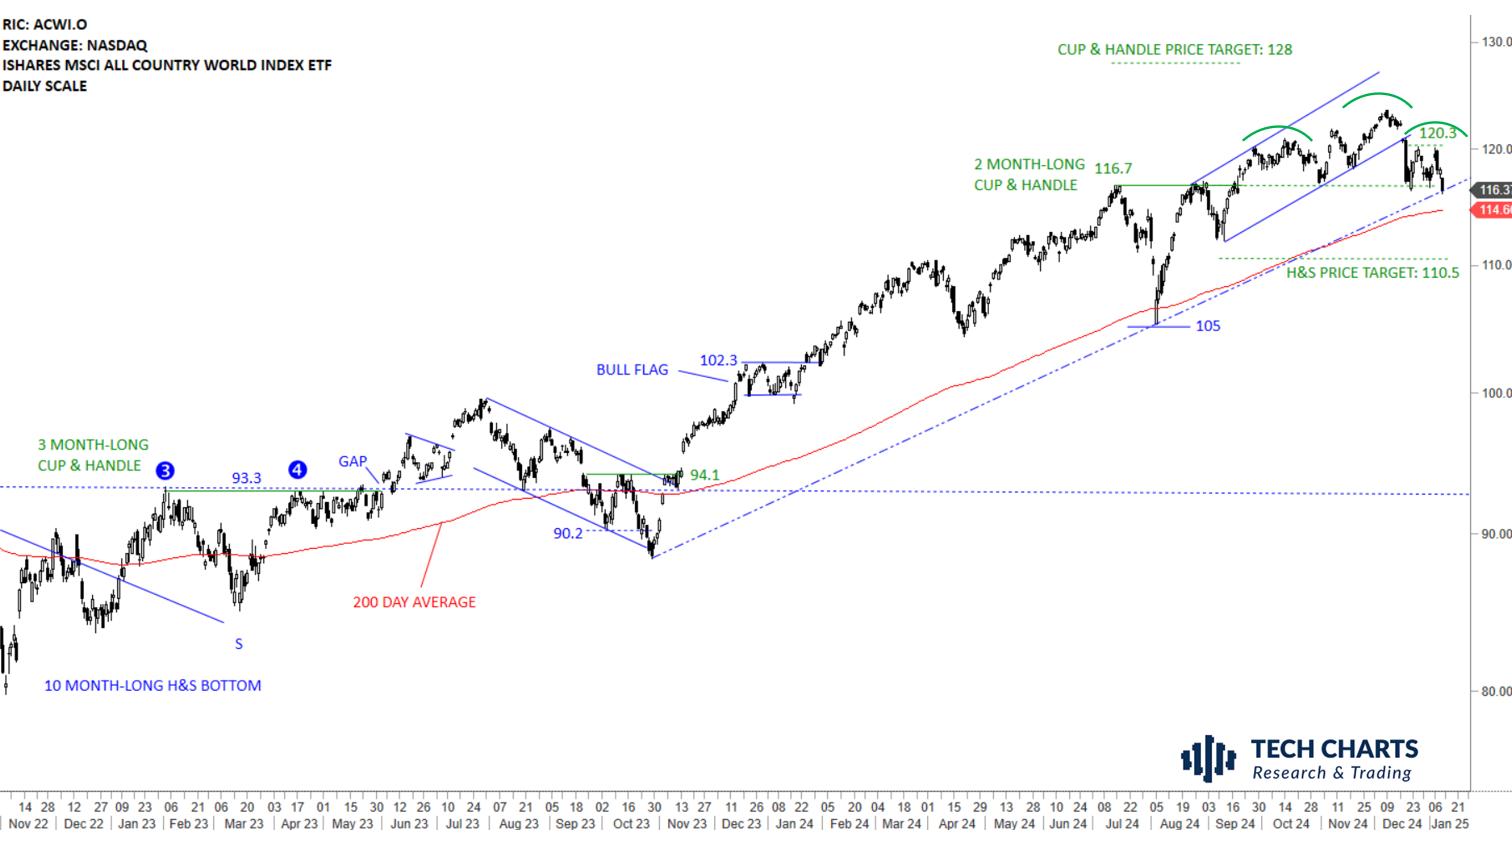
The benchmark for the Global equity markets performance, the iShares MSCI All Country World Index ETF (ACWI.O) is testing support area between 114.6 and 116.7. The lower boundary of the upward sloping channel at 120 levels broke down with gap opening. While the uptrend is intact and the ETF is above the 200-day average, price action can remain weak and volatile in the short-term. Several technical support levels are overlapping between 114.6 and 116.7 area. One possibility is the developing and completion of the H&S top if the support area is broken down. Strength from current levels and a breach above 120.3 levels can result in a H&S top failure and resume the uptrend. Breakdown of the support area (I would like to see a decisive close below the 200-day average to confirm the H&S top) can target 110.5 levels.
 Read More
CRYPTOCURRENCIES – January 5, 2024
BTCUSD cleared the horizontal resistance at 73.7K to new all-time highs. Clear breakout signal from the broadening pattern on weekly scale. Price is consolidating earlier gains. The daily scale chart is headed for a short-term H&S top failure if price can clear 100K. ETHUSD breaks the upper boundary of its short-term consolidation at 2,800 levels and pushes above the year-long average though still hasn't cleared the 4,000 levels. Read More

