
GLOBAL EQUITY MARKETS – March 1, 2025
REVIEW
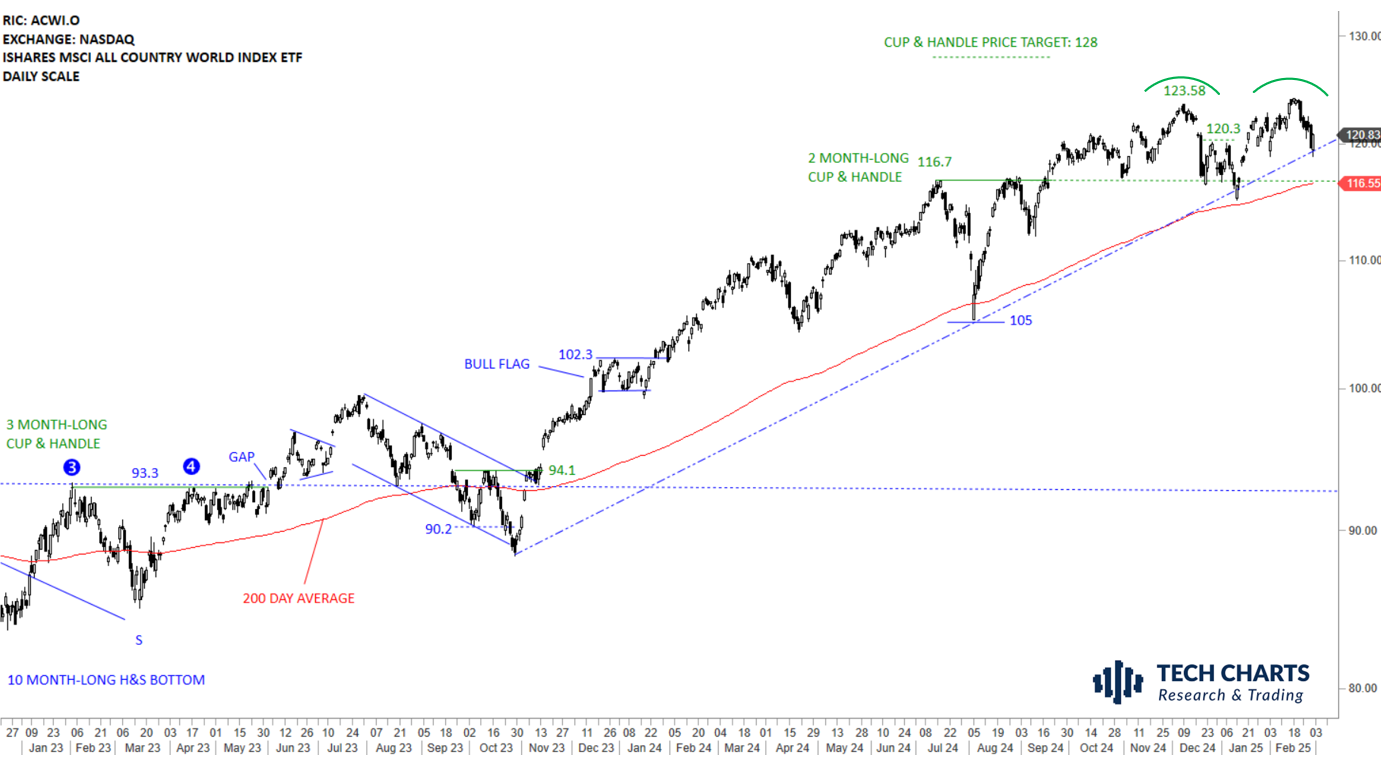
The benchmark for the Global equity markets performance, the iShares MSCI All Country World Index ETF (ACWI.O) rebounded strongly from support area between 116.03 and 116.7. 123.58 acted as the short-term resistance. Uptrend is intact in Global Equities. Weakness towards the 200-day average and the horizontal support at 116.7 levels can increase the probability of a double top reversal. The ETF found short-term support at the year-long trend line.
 Read More
GLOBAL EQUITY MARKETS – February 22, 2025
REVIEW
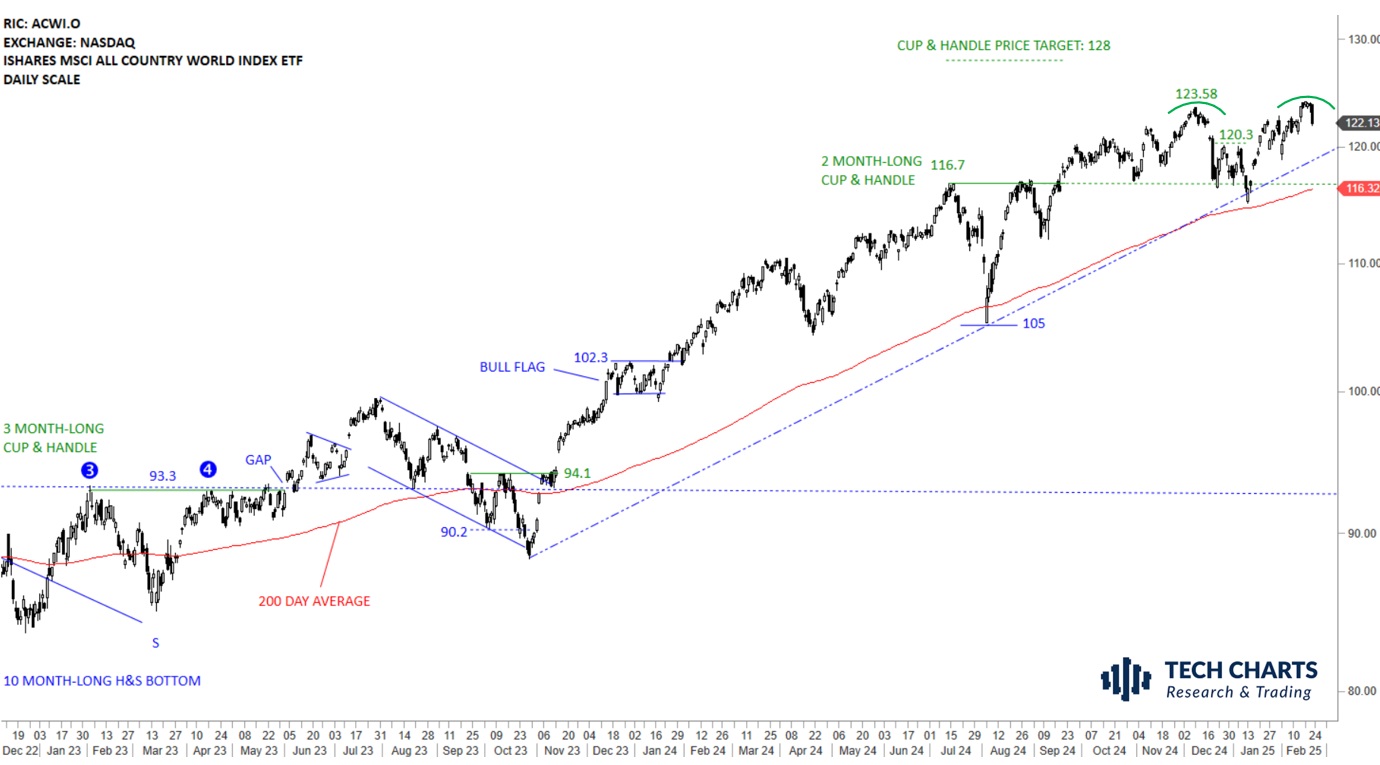
The benchmark for the Global equity markets performance, the iShares MSCI All Country World Index ETF (ACWI.O) rebounded strongly from support area between 116.03 and 116.7. The breach above 120.3 levels resulted in a H&S top failure and now resuming the uptrend. 123.58 acted as the next short-term resistance. Uptrend is intact in Global Equities. Weakness towards the 200-day average and the horizontal support at 116.7 levels can increase the probability of a double top reversal.
 Read More
CRYPTOCURRENCIES – February 16, 2025
BTCUSD cleared the horizontal resistance at 73.7K to new all-time highs. Clear breakout signal from the broadening pattern on weekly scale. Price is consolidating earlier gains. A possible short-term consolidation is taking place between 109K and 91.2K. Monitoring the short consolidation on BTCUSD to understand if it will act as bullish continuation or top reversal. Read More

