
BREAKOUT ROOM MONDAY 10th of March 10:00 AM EST – LIVE MEETING, CHARTS Q&A
BREAKOUT ROOM Monday 10th of March 10:00 AM EST - LIVE MEETING, CHARTS Q&A
Meeting Outline- Q&A on charts of your interest
Tech Charts Members,
This is our first Breakout Room meeting to discuss chart of your interest. I will share my screen and will pull up chart of your request and review patterns and opportunities from the perspective of classical charting principles. Let's give it a try and if we find it useful we will make it a recurring event. Meeting will be recorded and posted on member website.
Read More
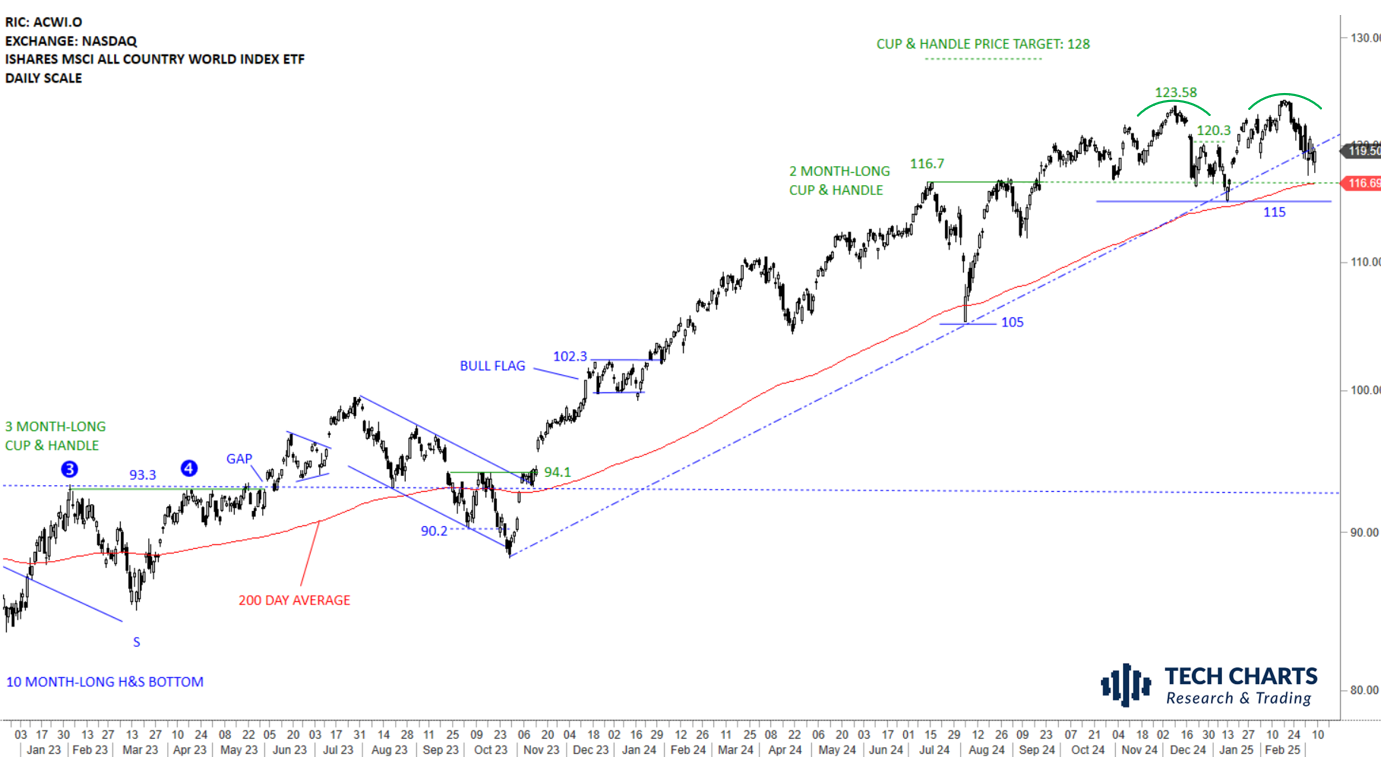
GLOBAL EQUITY MARKETS – March 8, 2025
REVIEW
The benchmark for the Global equity markets performance, the iShares MSCI All Country World Index ETF (ACWI.O) rebounded strongly from support area between 116.03 and 116.7. 123.58 acted as the short-term resistance. Uptrend is intact in Global Equities. Weakness towards the 200-day average and the horizontal support at 116.7 levels can increase the probability of a double top reversal. The ETF is possibly looking for direction above the year-long average. If the developing pattern is a double top, the neckline at 115 levels will be the level to monitor for a breakdown confirmation.
 Read More
CRYPTOCURRENCIES – March 3, 2025
BTCUSD cleared the horizontal resistance at 73.7K to new all-time highs. Clear breakout signal from the broadening pattern on weekly scale. Price is consolidating earlier gains. The weekly close was inside the consolidation range (91.2K-109K) and there is no breakdown confirmation at this stage. Read More

