
Quarterly Review of Chart Pattern Reliability Numbers and Review of Global Markets – March 2025 Tech Charts Member Webinar
Quarterly Review of Chart Pattern Reliability Numbers and Review of Global Markets - March 2025 Tech Charts Member Webinar
Webinar Outline- Review of chart pattern statistics and discussion on chart pattern reliability covering the YTD numbers and 8-Year historical stats
- Examples on different Types of breakouts and discussion on managing those breakout alerts
- Review of Global Equity & Commodity market trends
- Live Q&A

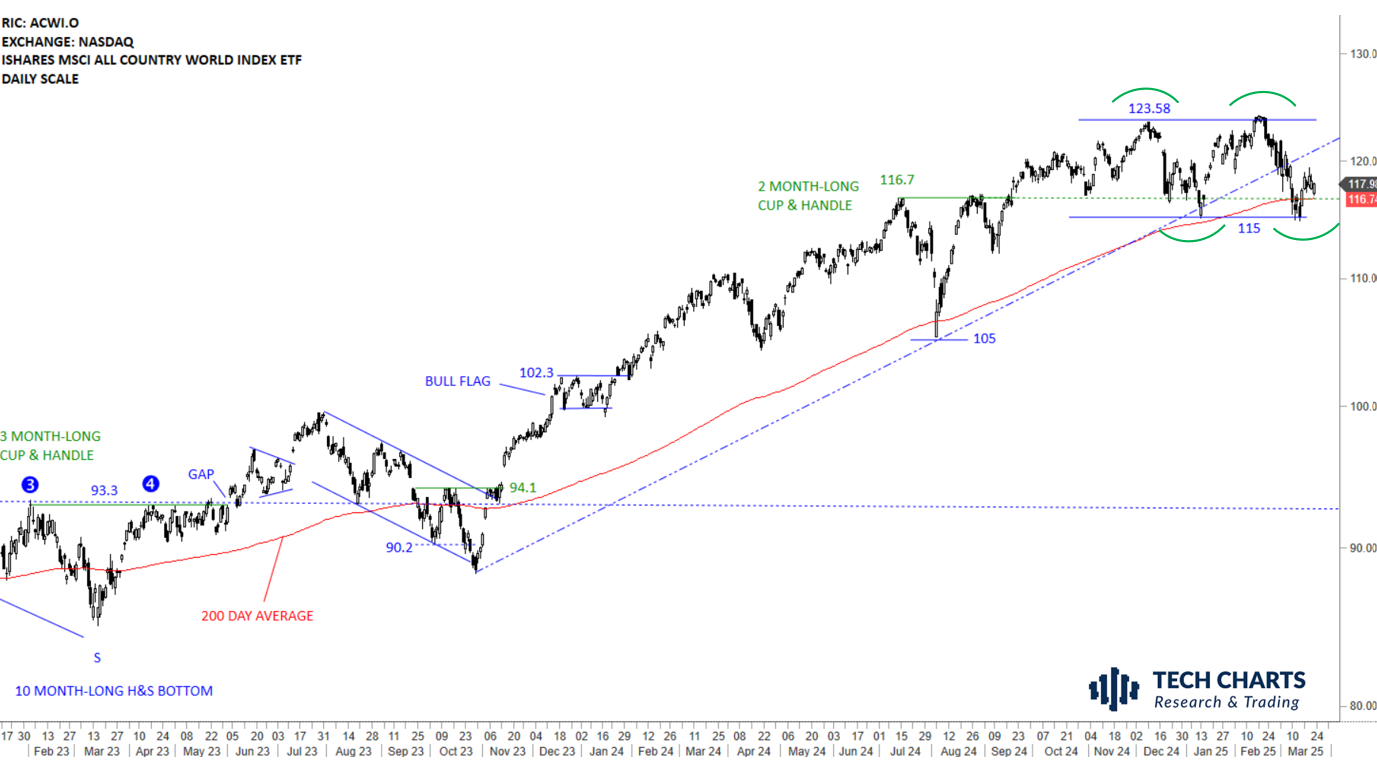
GLOBAL EQUITY MARKETS – March 22, 2025
REVIEW
The benchmark for the Global equity markets performance, the iShares MSCI All Country World Index ETF (ACWI.O) found support at the lower boundary and the 200-day average. Uptrend is intact in Global Equities. Failure to hold above 115 levels can complete the consolidation as a double top. The ETF is possibly looking for direction above the year-long average. If the developing pattern is a double top, the neckline at 115 levels will be the level to monitor for a breakdown confirmation. Stability above the year-long average can resume the sideways trading between 115 an 123.58 levels.
 Read More
Live Webinar and Q&A with Aksel – Thursday, March 20th, 8:30 am Mountain
Dear Tech Charts Members,
We continue our Member webinar series with chart pattern reliability statistics for the Year to Date and past 8 years. We plan to have an interactive and open discussion session to answer members' questions on markets and specific charts of interest. Please send your charts and questions to aksel@techcharts.net, and I will add them to the webinar discussion points.
Scheduled for: Thursday, March 20th, 8:30 am Mountain (register below)
Read More

