
GLOBAL EQUITY MARKETS – August 26, 2017
REVIEW
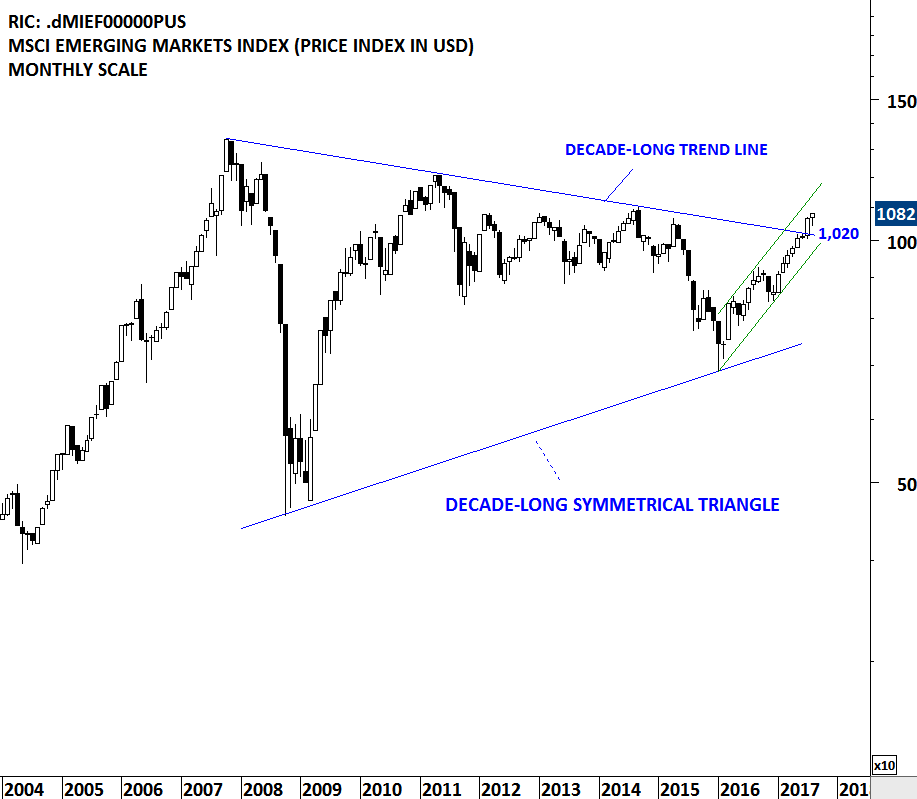
Strong weekly performance of the Chinese SSE Composite Index is worth mentioning in this weeks update. Strength in the Chinese equities helped MSCI Emerging Markets Index to remain resilient during the last few week's of global equity market weakness. MSCI Emerging Markets index that cleared decade-long trend resistance in July, held on to its earlier gains during the month of August.
 Read More
GLOBAL EQUITY MARKETS – August 19, 2017
REVIEW
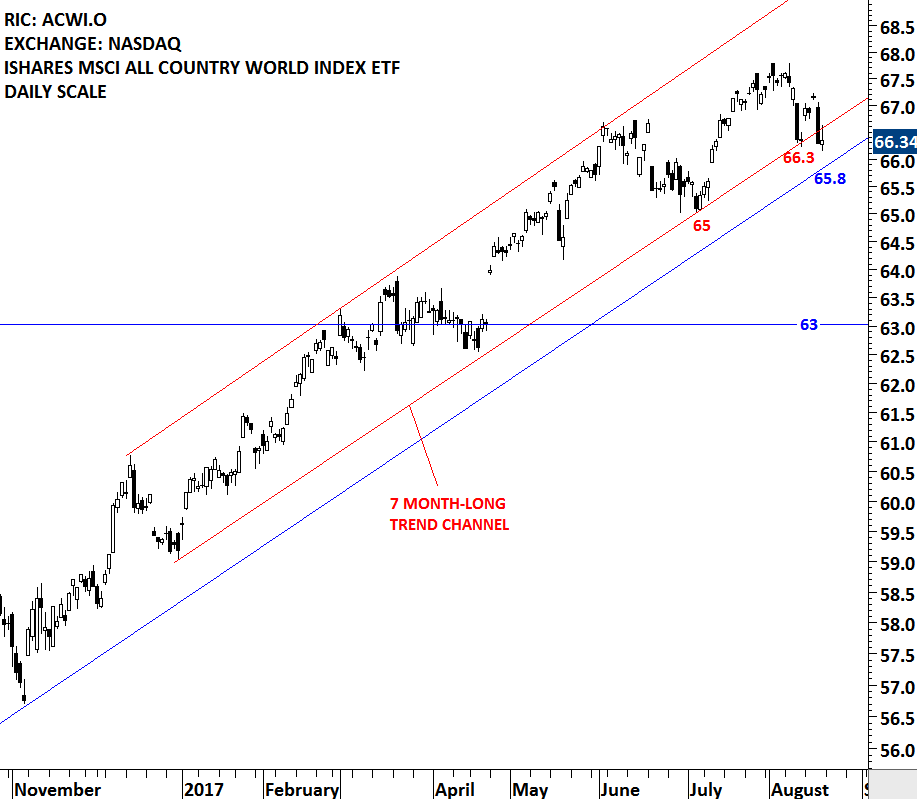
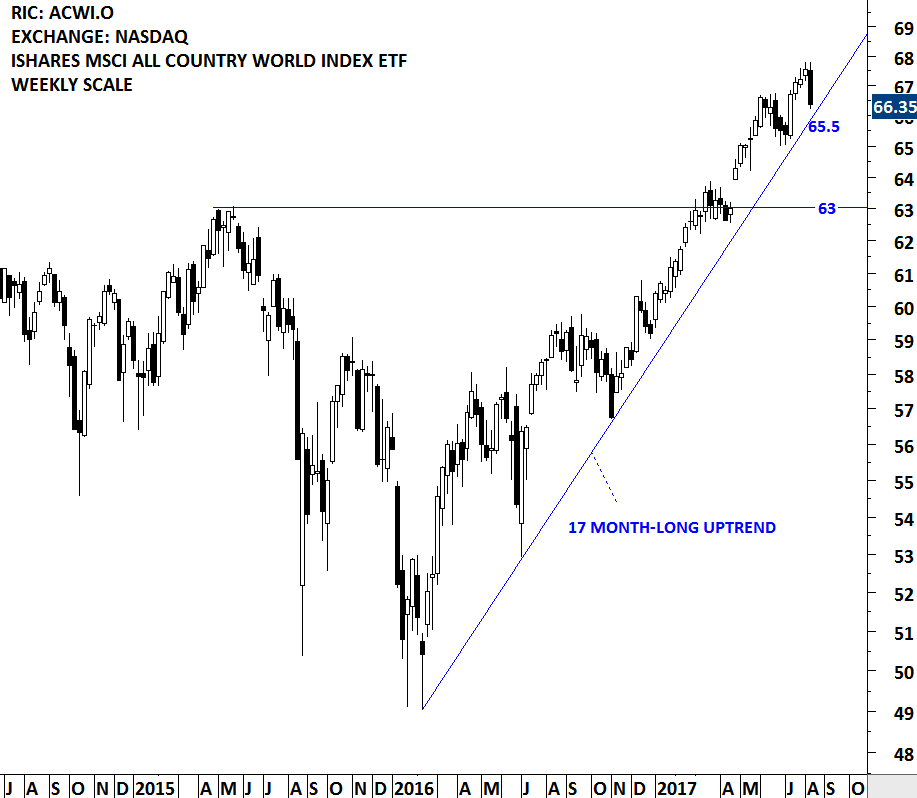
The iShare MSCI ACWI ETF is testing a 17 month-long upward trend line. The more a trend line or a support/resistance area is tested the more important it becomes. The long-term trend line has been tested several times. In the beginning of the week, the global equity benchmark ACWI rebounded from the lower boundary of its 7 month-long trend channel but finished at the same level on Friday. A breakdown below 66.3 levels can push the price towards the long-term trend line support at 65.8. Steep trend lines like the one we are seeing on the ACWI, can't extend for a long time. The trend needs adjustment, in other words find another low. (I added an S&P 500 chart below to better explain this point). The real test will be at 65.8 levels. Breakdown below that support can result in a correction towards 63 levels. Next week, I will be monitoring 66.3 and 65.8 levels closely. Important support area is between 65.8 and 66.3. I will issue interim updates if there is a change in the technical outlook.
 Read More
GLOBAL EQUITY MARKETS – August 12, 2017
REVIEW
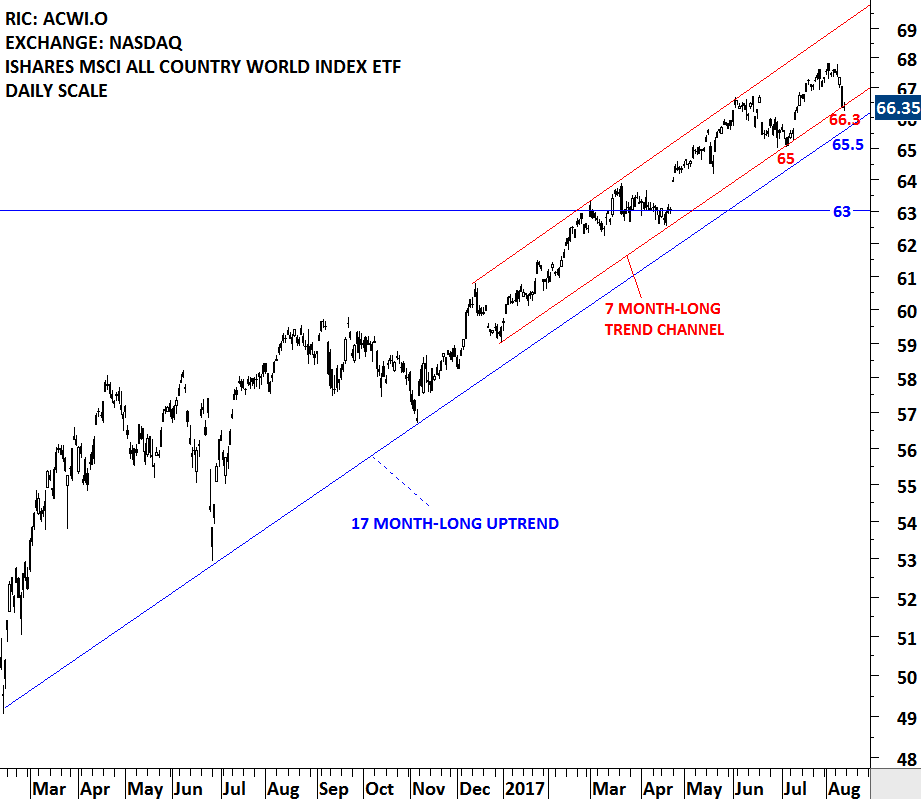
This week's price action did some technical damage on the charts. MSCI ALL COUNTRY WORLD INDEX ETF, a benchmark for global equity market performance gave back three weeks of gains in one weekly bar. The discussion on the financial networks and social media was about buying the dip. 66.3 is the lower boundary of the 7 month-long trend channel for the ACWI ETF. Failure to hold this support level can push the price to the next support at 65.5, which is the 17 month-long upward trendline. There is no clear chart pattern forming on the MSCI ACWI ETF. For those who are looking for sell signals on the ACWI, the breakdown of the trend channels should give some guidance. In case of further weakness in the global equity markets (a breakdown on the ACWI), this week's report should be helpful in identifying some of the bearish chart setups in the global equities and ETFs.
 Read More
