
GLOBAL EQUITY MARKETS – September 9, 2017
REVIEW
I am not sure if Volatility index can be analyzed from a classical charting perspective but over the past few months, the VIX futures and since 2016, the CBOE Volatility Index respected important support/resistance levels. Irrespective of the headlines related to geopolitical tensions, the three different continuation future price charts of the Volatility Index (Oct, Nov, Dec) are showing signs of multi-month bottoming process. The importance of 15-16 area as a resistance can be seen on the Volatility Index and the VIX futures price charts. Last one month's price action arguably formed tight consolidations in the form of a pennant/symmetrical triangle below the important horizontal resistance. I think we should keep a close eye on these charts in the coming weeks. Completion of the month-long tight consolidation range can result in a breakout above the strong resistance area between 15 and 16 levels.
Read More
GLOBAL EQUITY MARKETS – September 2, 2017
REVIEW
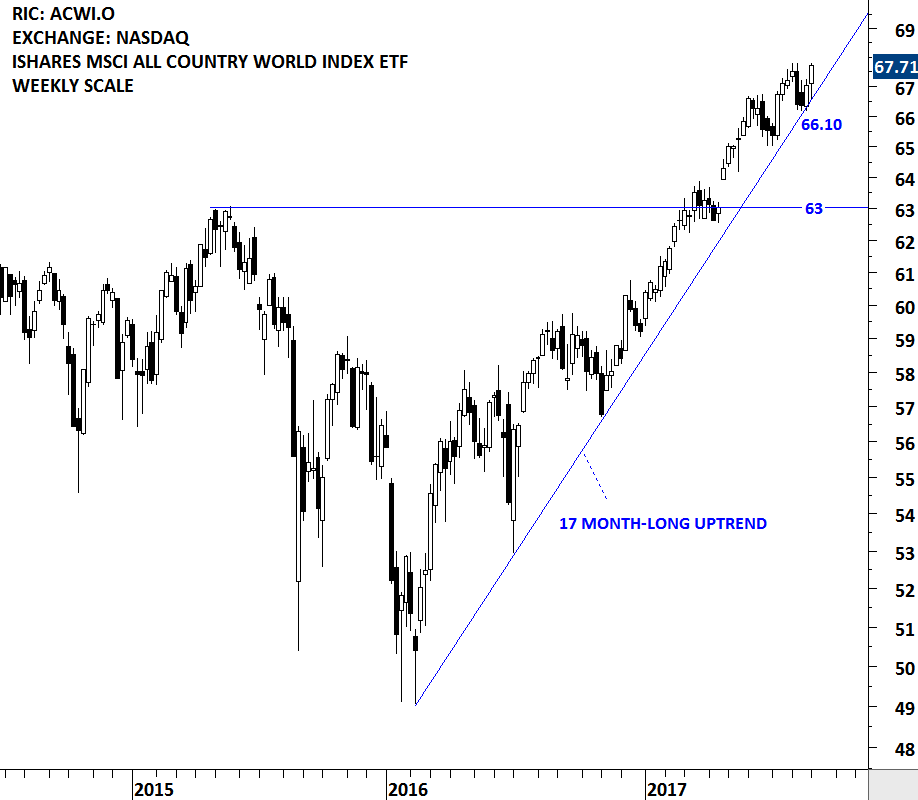
The iShares MSCI ACWI ETF seeks to track the investment results of an index composed of large and mid-capitalization developed and emerging market equities. It is a good measure of Global equity markets performance. The ETF is listed on the Nasdaq Stock Exchange. Over the past few weeks, the Global Equity Markets report reviewed the ACWI ETF and highlighted the importance of the multi-month uptrend and the trend line support. Last two week's price action rebounded from the steep trend line support at 66.10 levels and challenged the all-time highs. The long-term up trend is still intact and the multi-month trend support has become even more important. The more a technical level is tested the more important that level becomes. For now, our conclusion is that, the benchmark for global equity market performance is still moving higher with an important support (minor low and multi-month upward trend line) standing at at 66.10 levels.
 Read More
INTERIM UPDATE – August 29, 2017
When I started expanding the research and investment universe of Tech Charts back in 2011, it was my intention to offer members and followers a broad perspective on global financial markets opportunities from a classical charting point of view. Today, most of the financial markets are accessible via prime brokers, local brokers or dual listed equities (depository receipts) and Exchange Traded Funds (ETFs). Traders and investors find value in diversifying their portfolios in different asset classes as well as different geographies. The info graphic below highlights the importance of having a global perspective in financial markets research and investment.
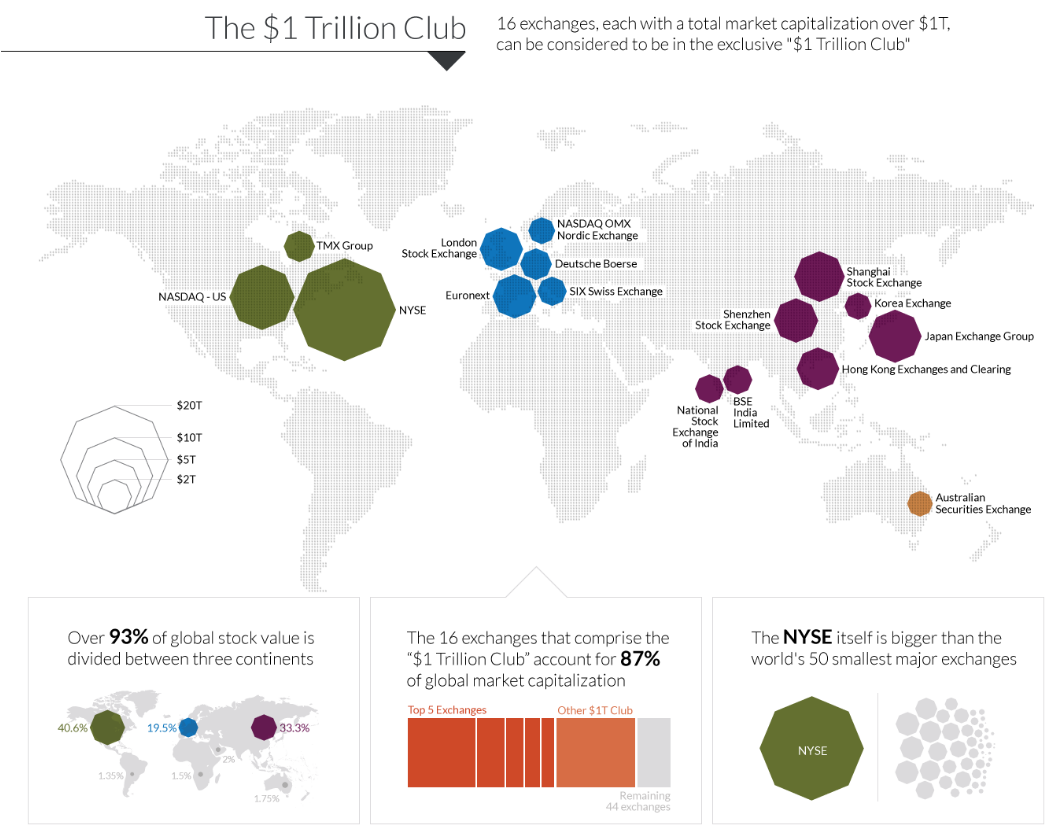 Data source: www.visualcapitalist.com
Read More
Data source: www.visualcapitalist.com
Read More
