
GLOBAL EQUITY MARKETS – October 14, 2017
REVIEW
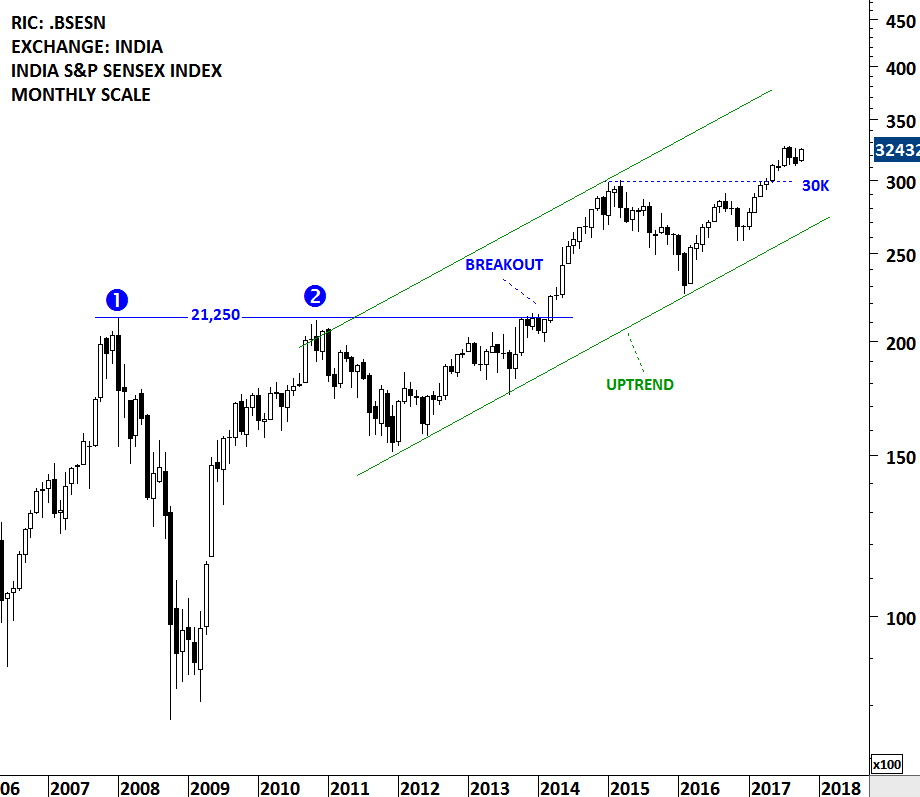
India equity benchmarks have been in a steady uptrend. For the past few months the BSE Sensex index and other equity benchmarks has been in a sideways consolidation. These short-term consolidations can prove to be bullish continuation chart patterns if resolved on the upside. On the long-term chart of BSE Sensex Index, 30K levels continue to form strong support. Long-term uptrend remains intact. Below I featured some of the bullish chart setups on India equity ETFs that are listed on the Nasdaq and New York Stock Exchange.
 Read More
INTERIM UPDATE – October 12, 2017
During a steady uptrend, pullbacks to long-term averages and to long-term trend line supports are usually good places to add to existing or enter new long positions. These pullbacks are usually a breath-taking period or a pause during the uptrend. As the pullback develops, it can either take the form of a top reversal formation or a continuation. A continuation chart pattern usually indicates the resumption of the uptrend.
There are two important chart developments on Alphabet Inc. and Johnson & Johnson that are worth mentioning. Both stocks have been in a steady uptrend. They are rising above their well-defined multi-year upward trend lines. Over the past 4 months, both equities formed a short-term sideways consolidation that can be identified as a rectangle. Given the direction of the previous trend, these rectangles can act as bullish continuation chart patterns.
Read More
GLOBAL EQUITY MARKETS – October 7, 2017
REVIEW
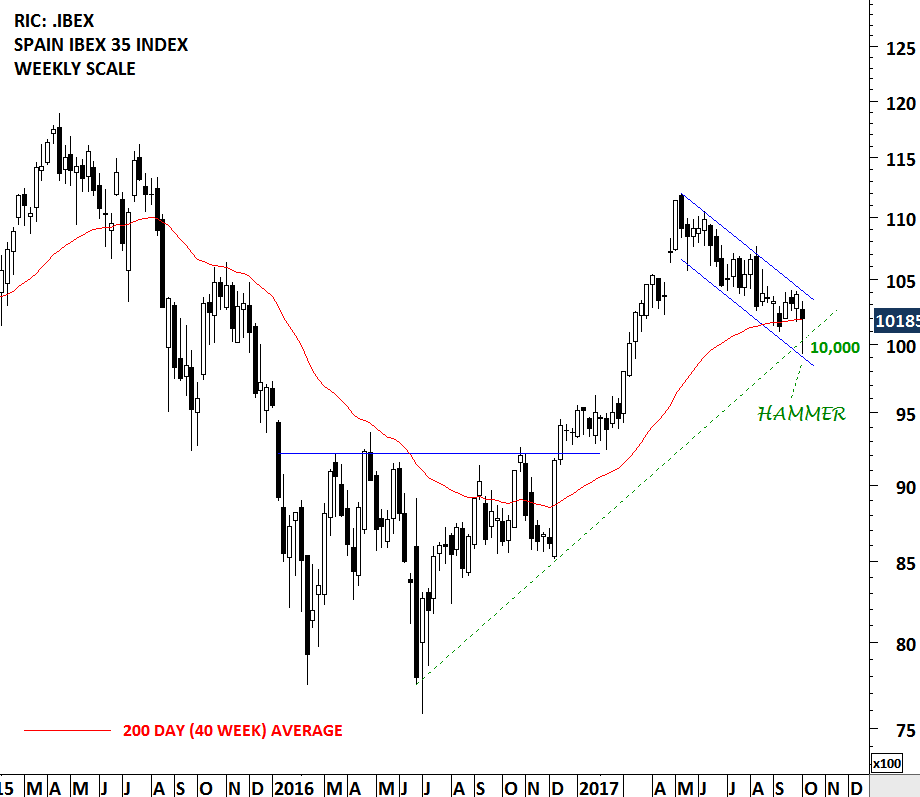
It has been a volatile week for Spanish politics and the country's financial assets. Spain's IBEX 35 index has been trending lower since May 2017. The downtrend in the short-term formed a well-defined trend channel. With this week's sell-off, the index rebounded from the lower boundary of the trend channel. There is no classical chart pattern that would suggest that index is finding a bottom or another chart pattern development that would signal further downside. However, two interesting candlestick patterns drew my attention which I find worth mentioning.
At inflection points, markets give clues about the internal dynamics of the price action. These are better identified on candlestick charts. The weekly chart of the IBEX 35 index formed a hammer. This bullish reversal candlestick pattern becomes more important if it forms at important support areas. We can see 3 important technical levels overlapping at 10,000 levels. These are; the lower boundary of the 5 month-long downward sloping trend channel, the 200 day (40 week) moving average and the year-long upward trend line.
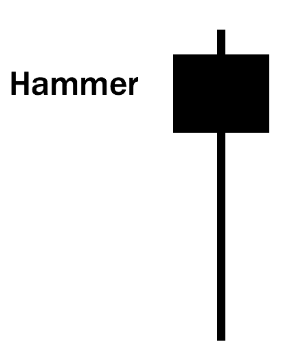
Hammer is a bullish reversal pattern that forms after a decline. In addition to a potential trend reversal, hammers can mark bottoms or support levels. After a decline, hammers signal a bullish revival. The low of the long lower shadow implies that sellers drove prices lower during the session. However, the strong finish indicates that buyers regained their footing to end the session on a strong note. While this may seem enough to act on, hammers require further bullish confirmation. Confirmation could come from a gap up or long white candlestick.
 Read More
