GLOBAL EQUITY MARKETS – March 3, 2018
Reminder on Live Webinar
Due to very positive feedback we got for the last webinar on rectangle chart patterns, we are continuing the webinar series with another reliable horizontal chart pattern; the ascending triangle. Live Webinar and Q&A with Aksel - Thursday, March 8, 11am mountain. You can register here (Register for the Live Webinar)
REVIEW
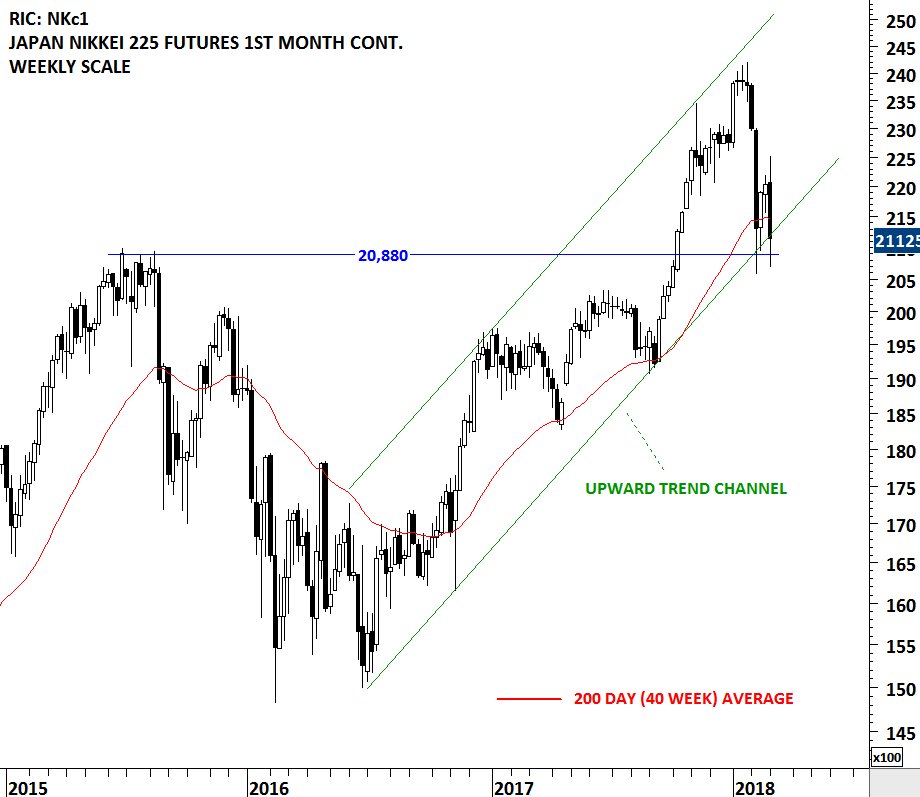
Equity indices that had weak rebound from the lows, tested the same support areas. Japan's Nikkei Index is one of them. On the weekly scale we can see that the upward trend channel is still intact with the support forming at 20,880 levels. On the daily scale price chart (futures price data to capture Friday's close) we can see that the Friday's recovery on U.S. indices helped the Nikkei Futures to form a Doji candlestick at the support. Failure to hold these levels can result in a larger scale correction. In the short-term Japan's Nikkei will try to find support around 20,880 levels and if it succeeds we will possibly label the price action as a double bottom.

Live Webinar and Q&A with Aksel – Thursday, March 8, 11am mountain
Due to very positive feedback we got for the last webinar on rectangle chart patterns, we are continuing the webinar series with another reliable horizontal chart pattern; the ascending triangle. Ascending triangle is a chart pattern with horizontal boundaries and has bullish implications. It can form as a bottom reversal or a bullish continuation chart pattern. Over the past couple of months the Global Equity Markets report has featured great chart setups that I identified as well-defined ascending triangles.
The upcoming webinar is dedicated to a thorough discussion on this reliable horizontal chart pattern.
- We will review some of those chart pattern breakouts that were featured in the Global Equity Markets report.
- We will look at some of the developing chart pattern breakout opportunities.
- We will continue to highlight Tech Charts members favorite ascending triangle setups in different equity markets. I would like to discuss and share some of the best classical chart patterns that members identified or those charts that members might have questions about.
- As usual we will have a member Q&A at the end of the webinar.
GLOBAL EQUITY MARKETS – February 24, 2018
REVIEW
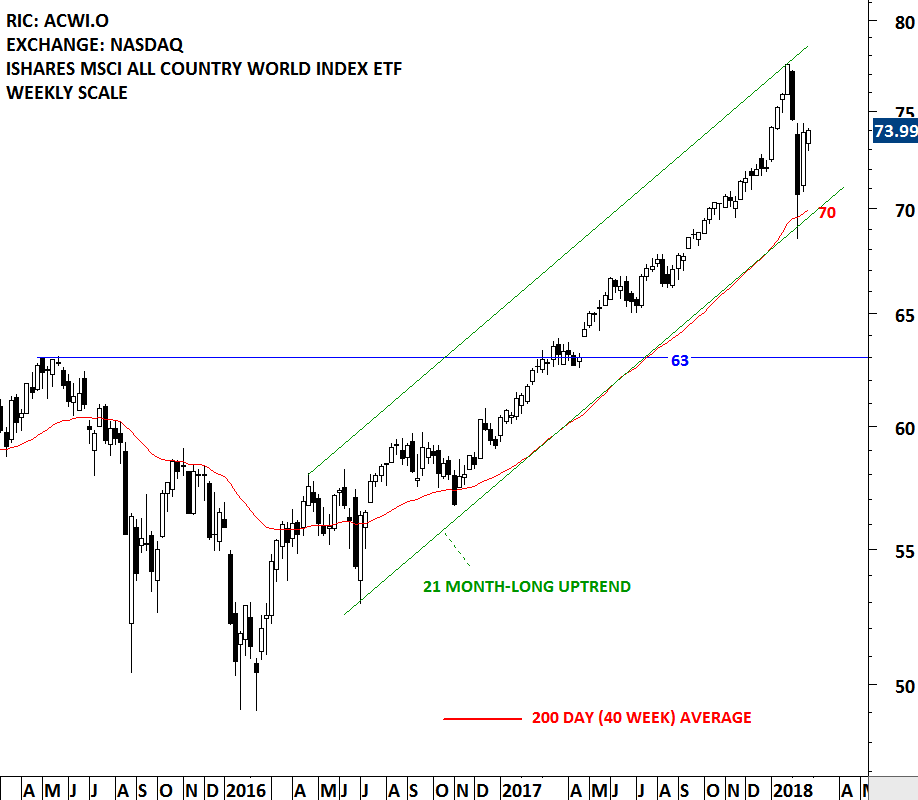
Global equity markets rebounded sharply and held on to last week's gains. I follow the iShares MSCI All Country World Index ETF (ACWI.O) as a benchmark for the Global equity markets performance. The ETF is in a steady uptrend above the long-term (200 day, 40 week) average. Volatility increased in the month of February after the sharp sell-off in the equity markets. The ACWI ETF tested its long-term average which is now acting as strong support at 70 levels. Choppy sideways price action can continue for some time until we see lower levels on volatility. Usually, markets go through a period of consolidation after sharp corrections. I think we are in that stage.