
GLOBAL EQUITY MARKETS – March 17, 2018
REVIEW
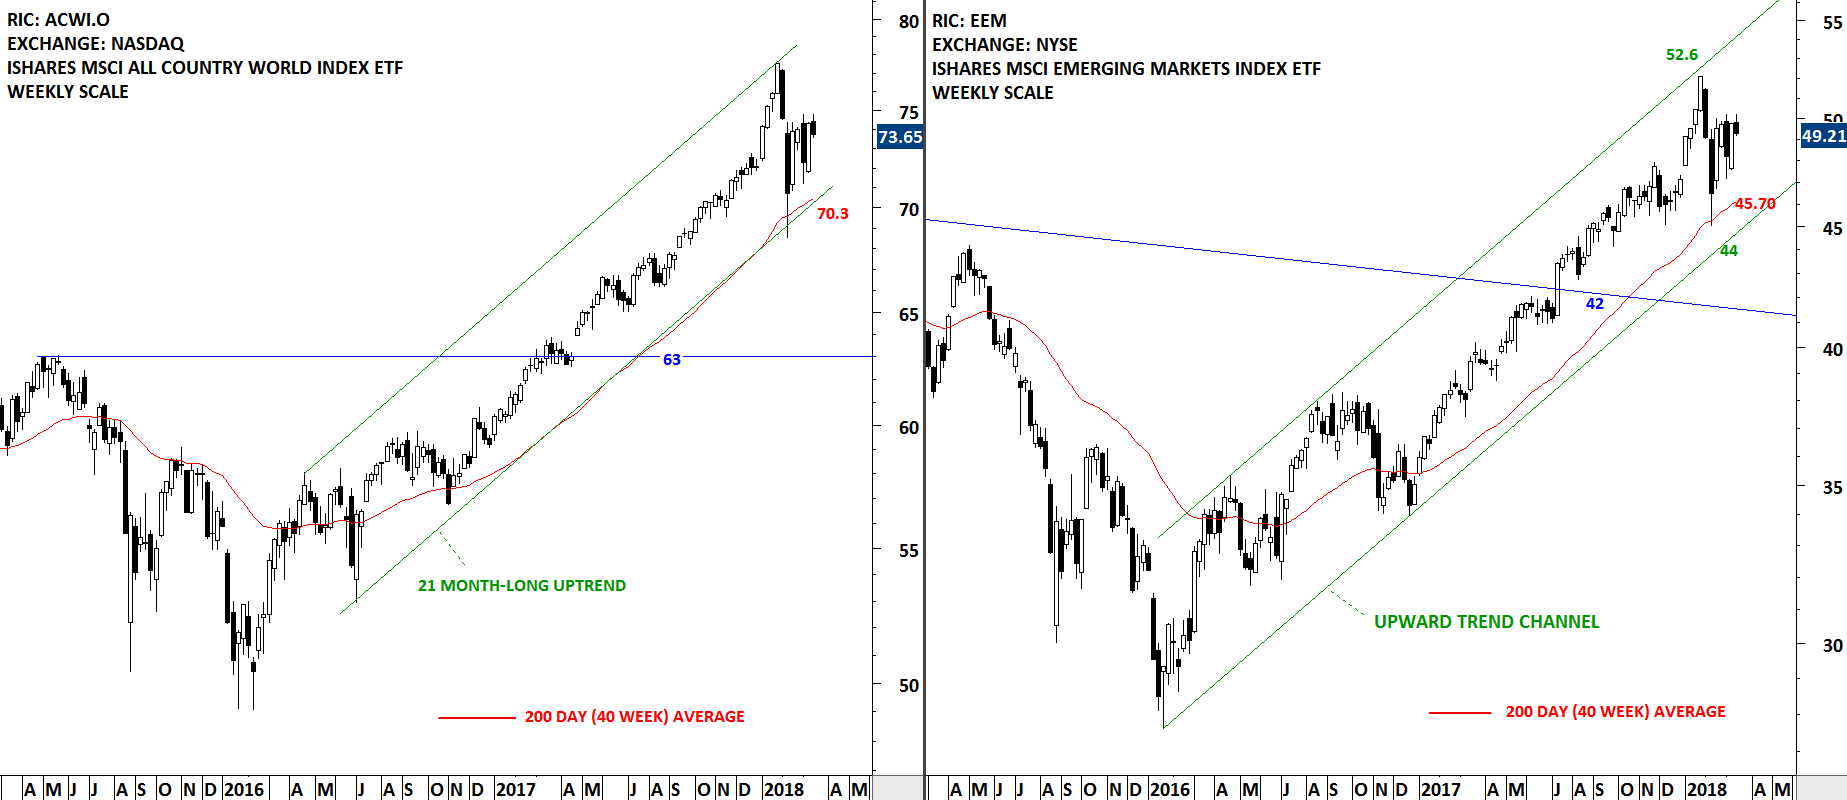
To summarize the current technical outlook in the Global Equity markets, I would say "range-bound". Global Equity benchmark charts below show the boundaries of the recent consolidations. After the sharp sell-off in the first half of February, global indices are returning back to low volatility conditions. Both the iShares MSCI All Country World Index ETF (ACWI.O) and the iShares MSCI Emerging Markets Index ETF (EEM) are in a long-term uptrend. Both benchmarks are above their long-term averages. Latest consolidations are taking place above strong support areas.

GLOBAL EQUITY MARKETS – March 10, 2018
REVIEW
A strong weekly close and especially a strong Friday price action is positive for Global equities. However, it is still early to conclude that the short term consolidation is over and we are headed to new all-time highs. I think we are still in the consolidation phase and choppy price action can continue for some time.
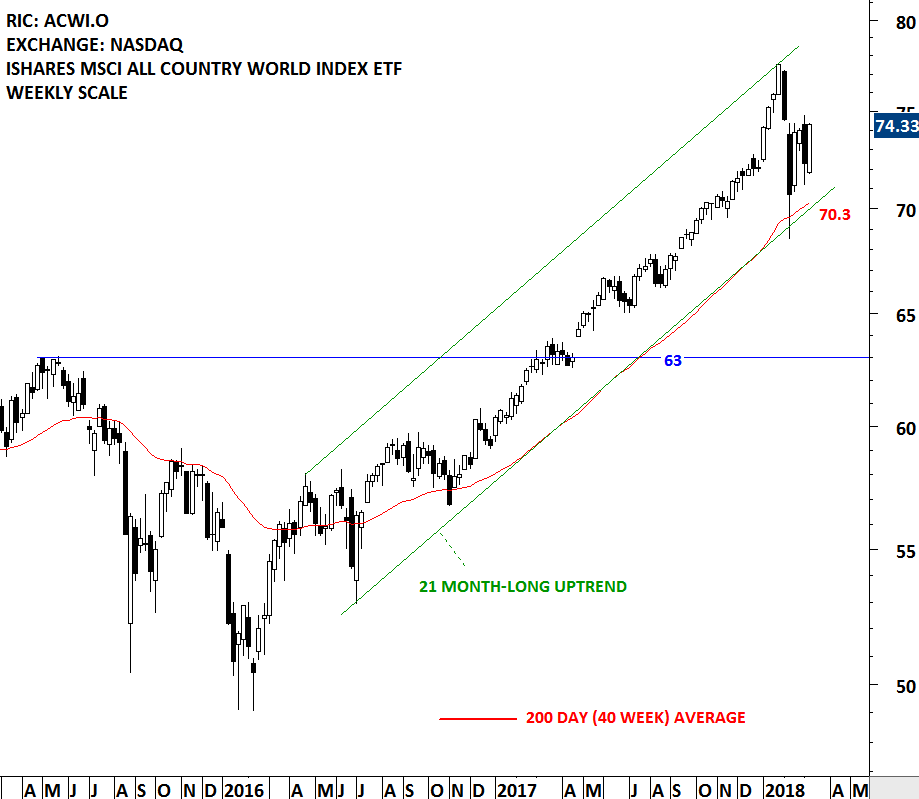
The long-term trend is upwards for the iShares MSCI All Country World Index ETF (ACWI.O). The benchmark for Global equity market performance continues to remain above its long-term average. In the short/medium-term, the ETF is in a trading range between the all-time high at 77.55 and 70 levels.
 Read More
INTERIM UPDATE – March 7, 2018
Reminder on Live Webinar
Due to very positive feedback we got for the last webinar on rectangle chart patterns, we are continuing the webinar series with another reliable horizontal chart pattern; the ascending triangle. Live Webinar and Q&A with Aksel - Thursday, March 8, 11am mountain. You can register here (Register for the Live Webinar)
Over the past few weeks Global Equity Markets report featured some great chart setups in U.S. Regional Banks & Financials. Some of those chart patterns are resolved on the upside and some are about to complete. As we see more strength in the sector I thought it is a good time to review some of those recent chart pattern developments. Read More

