
INTERIM UPDATE – March 29, 2018
Global equity markets are going through a volatile period. During this choppy price action we are seeing some technical damage on specific securities. This Interim Update features one of those breakdowns from a well-defined year-long descending triangle that is possibly acting as a top reversal chart pattern. Also the report highlights another similar bearish reversal chart pattern development in U.S. equities.

GLOBAL EQUITY MARKETS – March 24, 2018
REVIEW
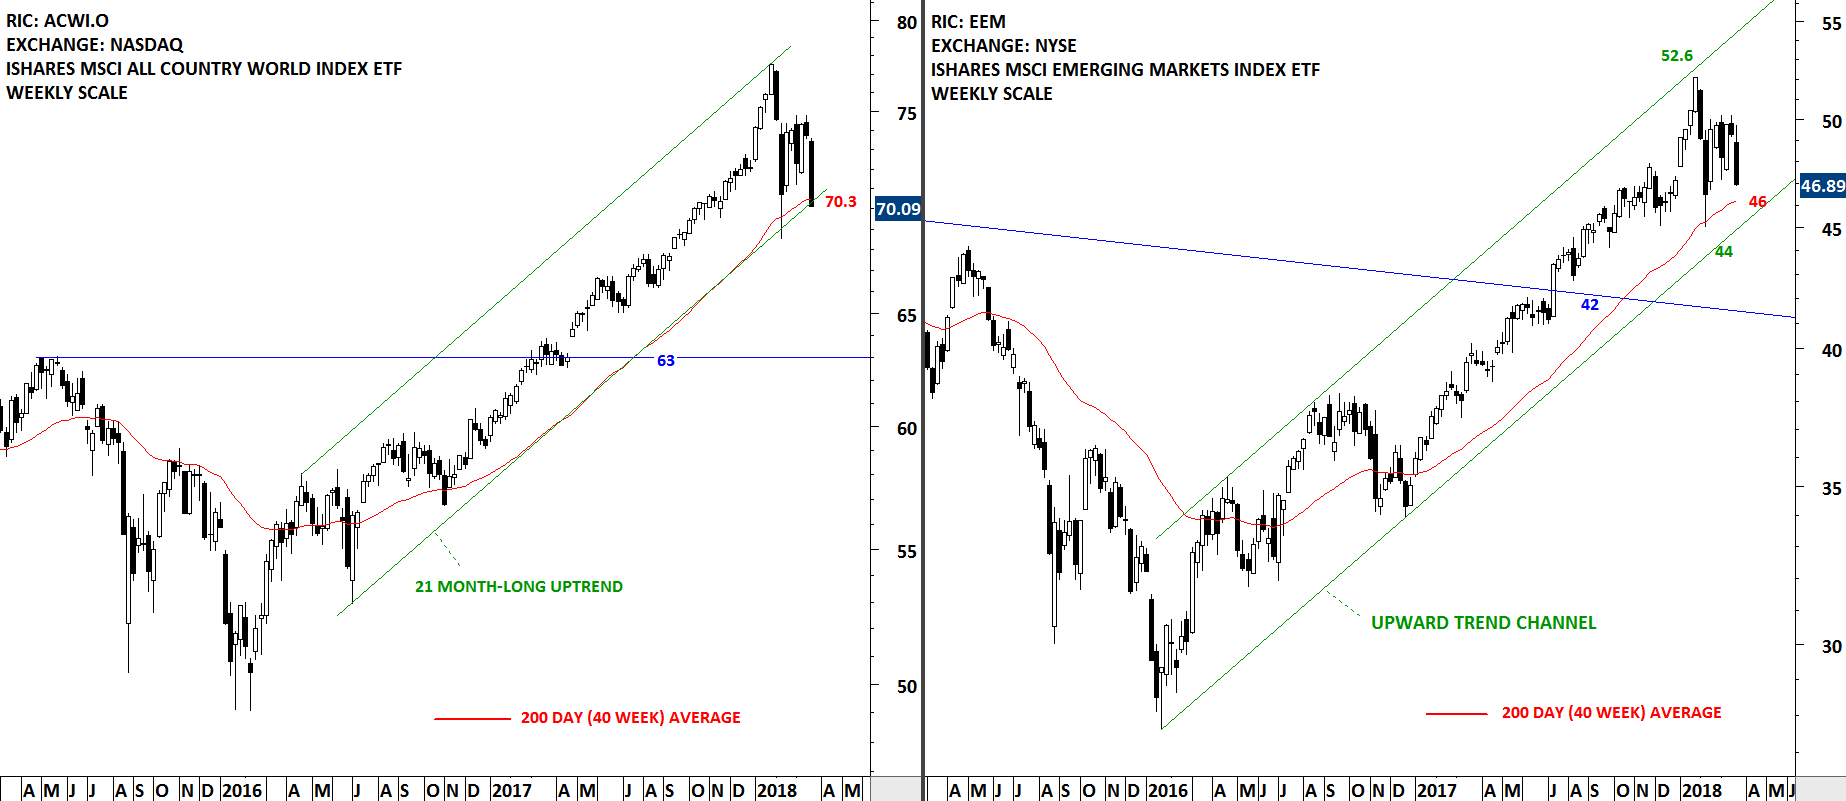
Both the iShares MSCI All Country World Index ETF and iShares MSCI Emerging Markets Index ETF are headed towards their February lows. Next few weeks will be important as these two Global equity benchmarks will tell us if the 2 year-long uptrend in equities is over or not. Breakdown below long-term averages will also violate the lower boundary of steady upward trend channels. While the iShares MSCI Emerging Markets index has margin towards the strong support area, the iShares MSCI All Country World Index closed the week at the support level. Unless we see a stability above 70 levels, the ETF can correct towards the next support at 63 levels.
 Read More
Ascending Triangle Chart Patterns – March 2018 Tech Charts Webinar
- Ascending triangle is a reliable bullish chart pattern that can act as a bottom reversal and continuation
- Breakouts from chart patterns with horizontal boundaries are more reliable when compared with breakouts from diagonal boundaries
- Important technical points when identifying ascending triangle chart patterns
- Importance of several tests of chart pattern boundary before a breakout takes place
- The broader context of price action and where the ascending triangle chart pattern forms
- Ascending triangle as a launching pattern
- Ascending triangle forming as a bottom reversal will take longer to develop
- Review of ascending triangle chart pattern breakouts between May 2017 and February 2017
- Defining chart pattern negation level and a logical point to label chart pattern negation on ascending triangle
- Recent chart pattern breakouts
- Developing ascending triangle chart patterns; a review of watchlist candidates
- Q&A
- Which broker do you recommend, where I can trade these stocks? I’m having a hard time finding one. 48:05
- If I’m new to classical charting, what should I do to learn how to identify each pattern? 49:45
- Any comment you care to make on the state of global markets? Europe and Japan look on edge… 51:44
- Do you actually search through hundreds of charts each week or do you use a software that alerts you to a breakout taking place across various markets? 53:14
- Science vs Art question - on the SBLK chart can you discuss your reasons for drawing the horizontal line where you did? 58:13
- Do you sell all your positions at profit target, if not how do you scale out? 1:00:33
- Do you look at currency and commodity patterns?1:01:23
- Do you look also for short sale candidates? 1:02:30
- Is there any point to consider when applying classical chart patterns on forex charts instead of stock? 1:04:50
- Do you have an estimate of timing - when the target should be met breaking out of these ascending triangle? 1:05:45

