GLOBAL EQUITY MARKETS – June 9, 2018
REVIEW
Benchmark for Global equity markets performance, the iShares MSCI All Country World Index ETF (ACWI.O) is challenging the upper boundary of its 4 month-long symmetrical triangle at 73.90 levels. Tight consolidation is taking place above the long-term average which is acting as support at 71.2 levels. Both the long-term average and the lower boundary of the 2 year-long uptrend are forming support around the same levels. ACWI ETF is in a steady uptrend. Decisive breakout above 73.90 can resume the multi-year long uptrend. Failure to move higher can result in another test of the long-term average at 71.2 levels.

GLOBAL EQUITY MARKETS – June 2, 2018
REVIEW
Benchmark for Global equity markets performance, the iShares MSCI All Country World Index ETF (ACWI.O) continues to consolidate in a tight range. Last 4 month's consolidation can be identified as a possible symmetrical triangle. Symmetrical triangle is a neutral chart pattern. Price can breakout in any direction. Strong resistance stands at 73.90 levels. Support, formed by both the lower boundary of the symmetrical triangle and the 200-day (40-week) moving average stands at 71 levels. Last 4 month's consolidation is taking place inside the 2 year-long uptrend channel. Long-term trend is upwards. Read More
GLOBAL EQUITY MARKETS – May 26, 2018
Announcement:
Dear Tech Charts members,
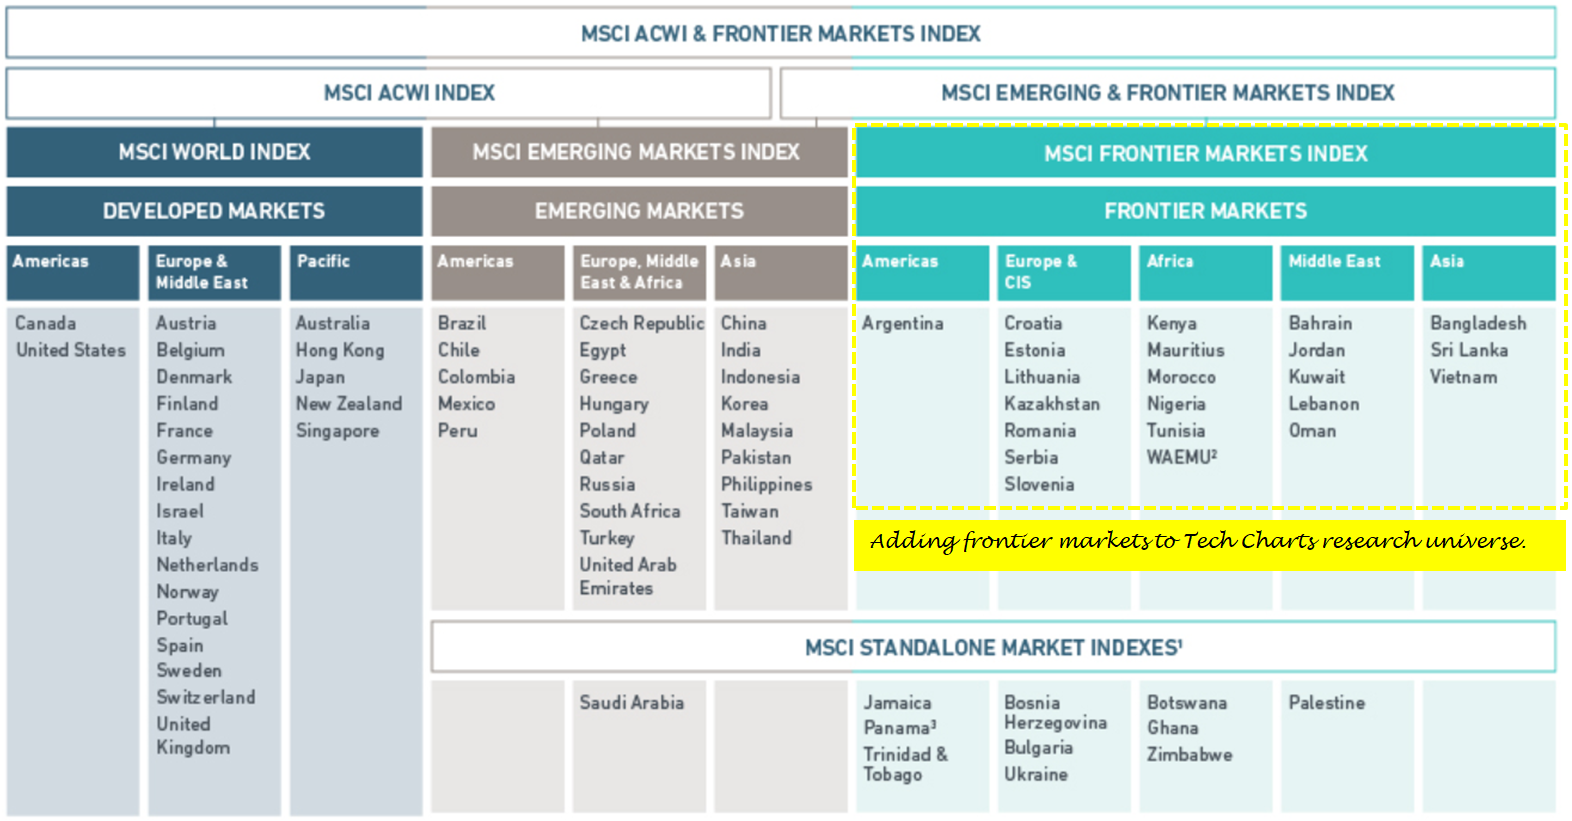
It has been a successful year since the launch of Tech Charts membership service. I'd like to take this opportunity to thank you all for your support. I hope to build a long lasting relationship with all of our members and hope to serve you in the coming years. I'm excited and motivated to improve our membership service every year. Going forward, Tech Charts Global Equity Markets report will include Frontier Markets into its research universe. Tech Charts follows the MSCI classification for market research. Below is a table that shows MSCI classification for each market. Global Equity Markets report is highlighting developing opportunities in Developed and Emerging Markets. We are now adding Frontier Markets equities to our report. Please note that coverage of a specific market doesn't mean you will find every equity available in that specific market. Global Equity Markets report features selective number of opportunities only if the price chart has a well-defined and mature classical chart pattern.

We have received several requests to include educational videos that explains basic concepts in Technical Analysis. For our members who are new to classical charting principles and technical analysis, we are planning to add new video tutorials. New educational videos on classical chart patterns are being produced as well.
As usual, please feel free to ask questions, send charts for discussions and feedback on any matter regarding your membership service.
I look forward to another great year.
REVIEW
Global equity markets remain in an uptrend. The iShares MSCI All Country World Index ETF is trading above its long-term average. Over the past 2 years the ETF has been moving in an upward trend channel. However, past 4 month's price action is now becoming more clear as a sideways consolidation. The ACWI ETF is possibly forming a 4 month-long symmetrical triangle with the upper boundary acting as resistance at 73.9 and support at 71.2 levels. Until the recent consolidation is resolved in one direction we will expect more choppy price action. A breakdown will confirm the 4 month-long symmetrical triangle as a bearish continuation chart pattern. Such price action will also take out the lower boundary of the trend channel and the 200-day (40 week) moving average and suggest lower prices. A decisive break above 73.90 levels will keep the long-term uptrend intact and push the ACWI ETF towards 77-78 area (previous high).
 Read More


