
Tech Charts Year in Review – Year Eight, May 2025 Webinar
- A study on Chart Pattern Reliability with the available sample data over the past year.
- Statistically significant and reliable top 3 chart patterns, rectangle, ascending triangle and H&S continuation are covered in detail.
- Statistics on different types of breakouts.
- The impact of different market cycles on chart pattern opportunities.
- Live Q&A
- I understand the logic of 200dma for continuation patterns; however, reversal patterns, by definition, indicate trend reversal. Do you still use the 200dma for reversal patterns? If so, why? 55:56
- Regarding the testing results, are they considering an entry when the price closes above the pattern confirmation level and a stop loss when the price touches the pattern negation level? Or what are the specific criteria to define a winning and losing trade? 58:44
- Is it weekly or daily used for breakout confirmation? 1:00:35
- Follow-up to question ONE - Does this dramatically reduce the number of opportunities you take for reversal patterns? 1:02:18

GLOBAL EQUITY MARKETS – May 31, 2025
REVIEW
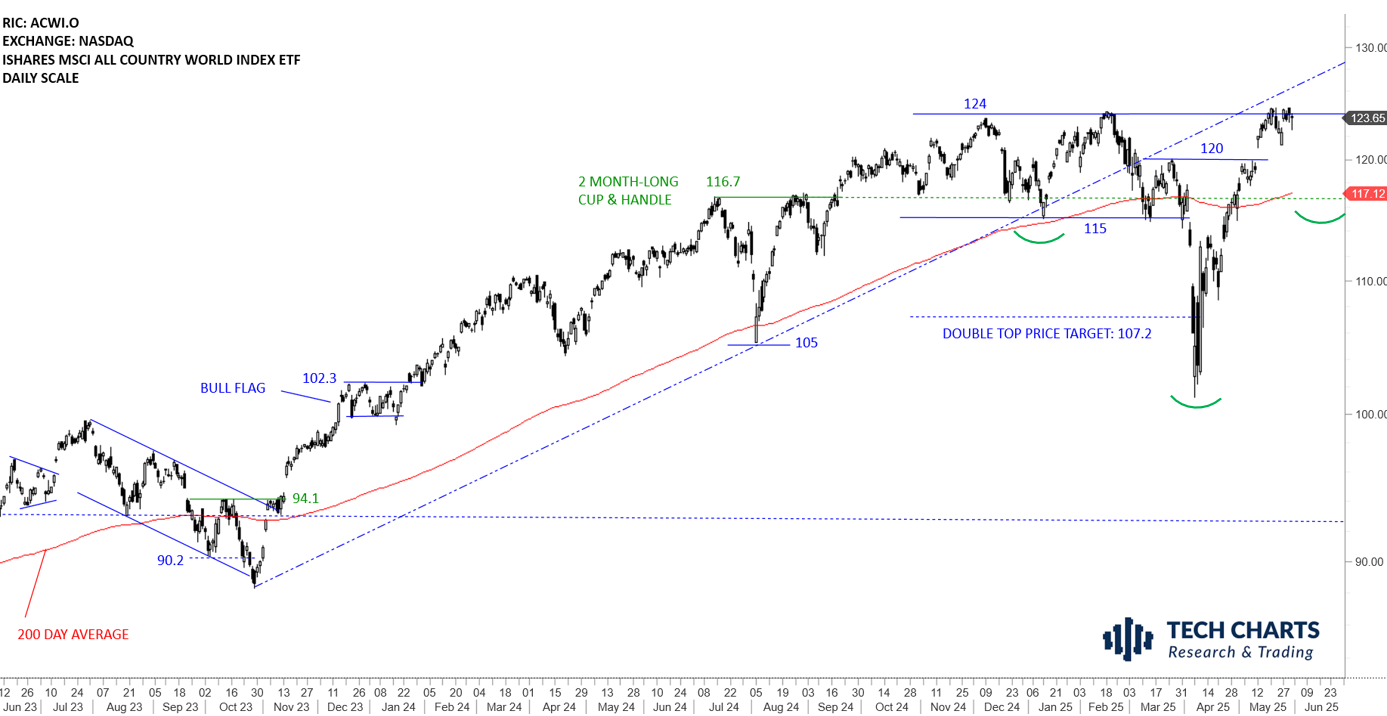
The benchmark for the Global equity markets performance, the iShares MSCI All Country World Index ETF (ACWI.O) did a round trip after the sharp sell-off and reached its all-time highs around 124 levels. The fact that the ETF cleared its 200-day average and moved significantly above it can be analyzed long-term positive as pullbacks and consolidations are likely to find support above the 200-day. I will monitor the ETF to see if it will stabilize above the long-term average in preparation of resuming higher. This can be the short breather after the ETF had a strong rebound. During the consolidation the ETF can form a possible H&S pattern with the neckline at 124 levels. 117.12-120 area will act as support during pullback. Outlook is positive for Global Equities.
 Read More
Tech Charts Year in Review with Aksel – Thursday, May 29th, 830 am mountain
- A study on Chart Pattern Reliability with the available sample data over the past year.
- Statistically significant and reliable top 3 chart patterns, rectangle, ascending triangle and H&S continuation will be under review.
- Detailed statistics on different types of breakouts.
- The impact of different market cycles on chart pattern opportunities.
- Live Q&A

