GLOBAL EQUITY MARKETS – July 14, 2018
REVIEW
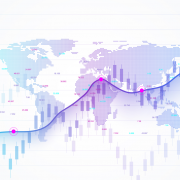
Until a chart pattern is mature and ready to resolve in one direction we have to make minor adjustments to the chart pattern boundaries. (Learn more: Morphology) Dealing with chart patterns and breakouts in real-time is difficult compared to labeling chart patterns on price charts in hindsight. Corrective periods are more tricky compared to trend periods because market corrections are periods of indecision between buyers and sellers whereas trend periods show consensus. The iShares MSCI All Country World Index ETF (ACWI.O) is going through a corrective period. The 5 month-long choppy sideways movement is possibly forming a symmetrical triangle between the boundaries of 70.4 and 74. This week's price action pushed the ETF above its long-term average. For the long-term uptrend to resume, price should remain above the 200 day-average.
Read More
GLOBAL EQUITY MARKETS – July 7, 2018
REVIEW
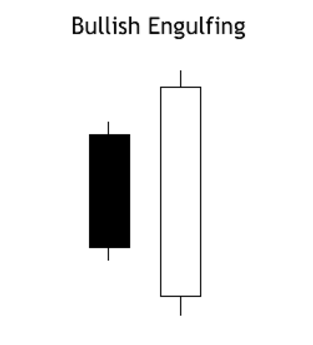
A bullish engulfing is a pattern that forms when a small black candlestick is followed by a large white candlestick that completely eclipses or “engulfs” the previous day’s/week’s candlestick. As implied in its name, this trend suggests the bulls have taken control of a security’s price movement from the bears. This type of pattern usually accompanies a declining trend in a security, suggesting a low or end to a security’s decline has occurred.
Where a bullish engulfing candle forms in the context of a trend is one of the most important factors. When a bullish engulfing candle forms at the end of a downtrend or at a support level, the reversal is much more powerful as it represents a capitulation bottom.
Read More
GLOBAL EQUITY MARKETS – June 30, 2018
REVIEW
If anybody tells you, "I know what the markets will do in the following weeks" he or she might be guessing. I will try to be as objective as possible with some of the major equity benchmarks and convey the message of my chart analysis. After the Jan-Feb 2018 sell-off on the ACWI ETF, price remained range-bound. The consolidation formed a possible 4 month-long symmetrical triangle (can act a bearish continuation). Both the lower boundary of the consolidation and the 200-day (40 week) moving average formed support around the same level. After each test over the past 4 months, the ETF rebounded from the 200-day moving average.
Read More
