GLOBAL EQUITY MARKETS – October 6, 2018
REVIEW
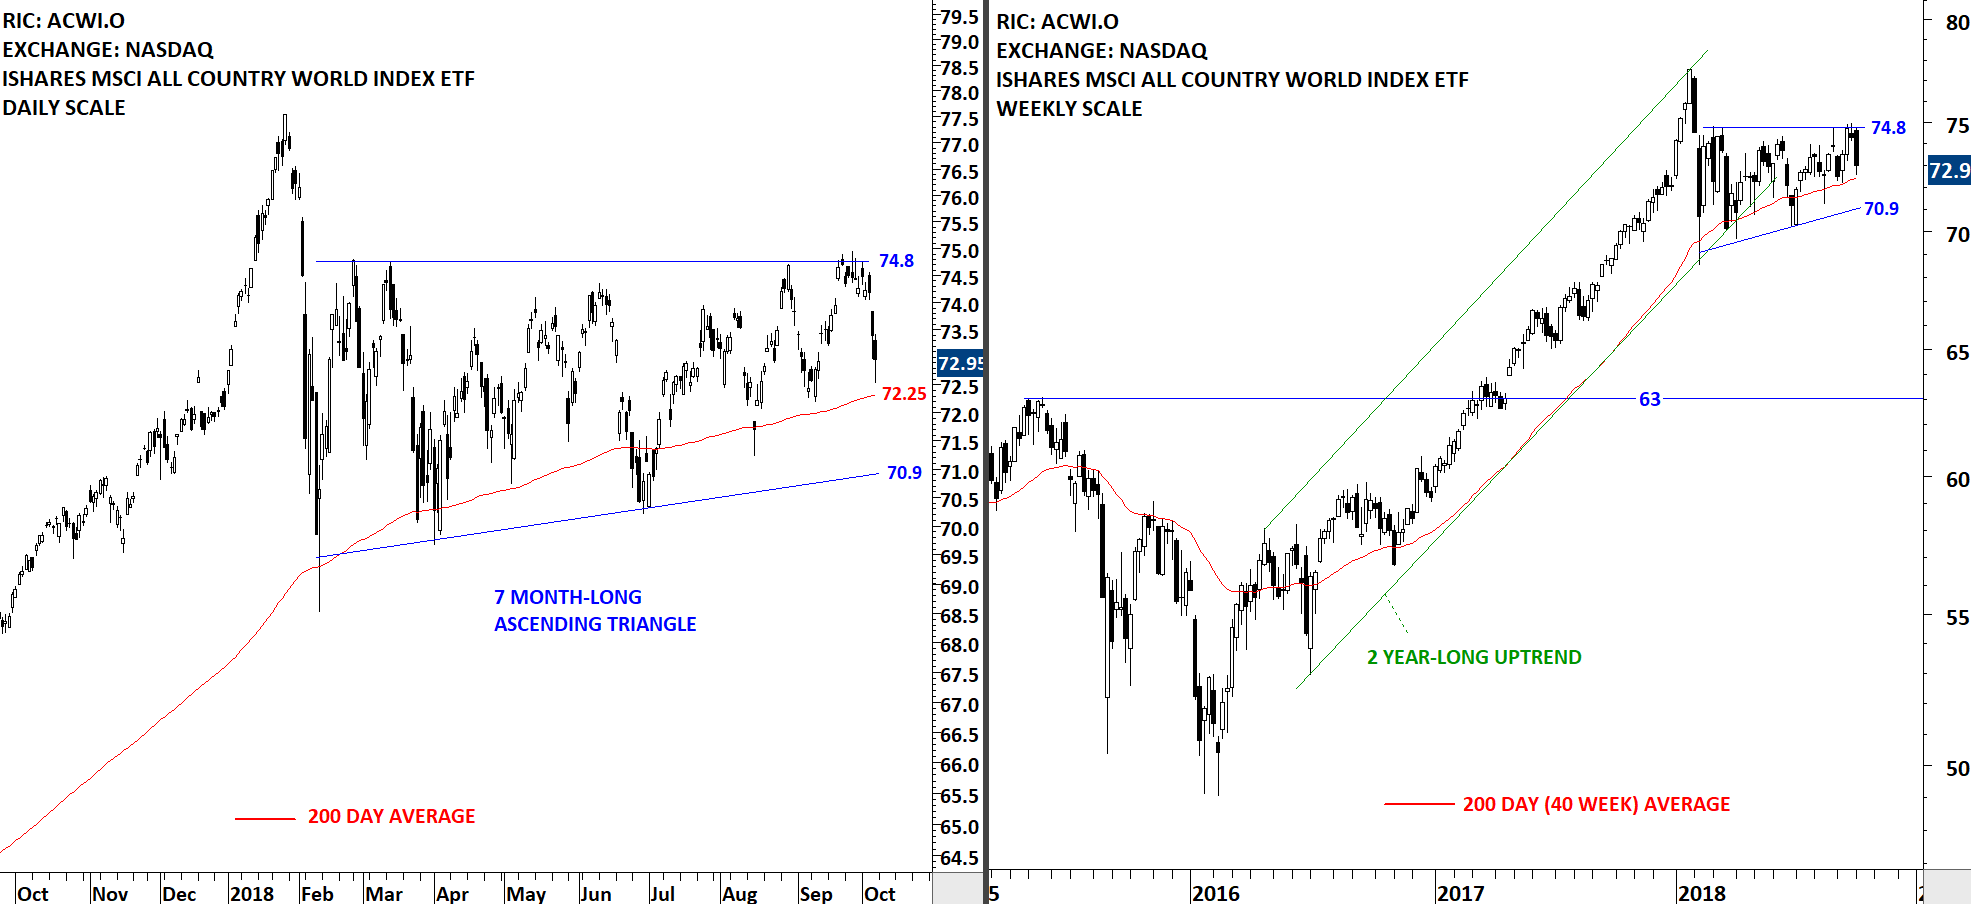
If one needs to explain what "trend less" market looks like, there is no better example other than the iShares MSCI All Country World Index ETF (ACWI.O). Since the beginning of the year the ACWI ETF is stuck in a tight range between 75 and 70. Usually a low volatility period like this is followed by a strong directional movement. ACWI ETF has strong resistance at 74.8 and support at 70.9 levels. The ETF is still holding above its long-term average.
 Read More
Symmetrical Triangle Chart Patterns – September 2018 Tech Charts Webinar
- The symmetrical triangle is a chart pattern with diagonal boundaries and it is a neutral chart pattern. It can form as a reversal as well as a continuation chart pattern.
- A symmetrical triangle forms due to the indecision between buyers and sellers.
- Review chart pattern breakouts that were featured in the Global Equity Markets report.
- Review some of the failed breakouts and try to analyze what differentiates a successful breakout from a failed breakout.
- Developing symmetrical triangle chart pattern setups.
- Highlight Tech Charts members favorite symmetrical triangle setups in different equity markets. Discuss and share some of the best classical chart patterns that members identified or those charts that members might have questions about.
- Recent chart pattern breakouts
- Q&A
- Live questions from Members
- Is there a way to distinguish better, stronger, higher probability chart patterns from the large number of those that get published on your watchlist/breakout lists. I am having a hard time choosing the few that I can afford to trade. I am giving priority to horizontal patterns where breakout will be new all time high? Is there another characteristic you would suggest using to screen for higher quality patterns? 54:35
- What’s your minimum W/L Ratio for entering a trade? 56:53
- What's the difference between symmetrical triangle reversal formation and a bullish or bearish pennant, before the breakout happens? (For example, Peter Brandt has been talking about USD/TRY pair, is that a pennant or a triangle?) 58:48
- In your Global Equity Market update you have charted "ACWI" as a symmetrical triangle on the weekly chart - what would need to happen for you to reclassify the chart as an ascending triangle? 1:00:26
- The 3% break out rule is it valid also for the futures market or only for stocks? 1:01:34
- Is the 'red' line on the chart patterns a stop level or pattern negation level? If the latter, where does one place stops typically? 1:03:14
- I hear you say often that the best breakouts are those that ‘never look back’. In hindsight analysis I very much agree. But in realtime, without some sort of pullback, I find it very difficult to enter such breakouts with a good reward-to-risk ratio (the price runs away from Moving Averages and other stop-loss indicators and never allows them to catch up). How would you recommend trying to enter these ‘best’ breakouts? How to place stop loss if reversal? 1:05:59
- Confused about what to consider a breakout. Can you define at what point exactly a symmetrical triangle can be considered a pattern breakout? (Not the 3% confirmation point, but the actual level required to call it a breakout). Seems like you are using the actual chart boundary in some cases, but a prior high in other cases (for upward breakouts). 1:07:56
- It seems like most of the charts are around 10 months to 24 months or so; is that what you focus on as a time length for these patterns? Of the successful triangles; how long (as a %) of the pattern length does it take to meet the target (or 70% of target for those that don't make it all the way)? 1:09:22
- Most of the charts you show are generally 1:1 or 1:1.5 risk reward. That means my batting average should be more than 50% to be profitable. How to reduce the risk and increase 1:3 risk reward? 1:11:16
- Do you have any statistics on success rates of breakouts reaching targets vs. failure, etc.? 1:12:14
- Is it appropriate to have increased confidence in patterns with another launching pattern within it. For example, increased position size? 1:14:01
- Is there a point in the triangle where strength of the pattern diminishes (e.g., past 50% or 75% of the distance to the apex of the triangle? 1:14:30
- Just be clear on breakouts... So 3% confirmation point is calculated from the point that price first penetrates the triangle boundary? Am I right? 1:15:55

GLOBAL EQUITY MARKETS – September 29, 2018
REVIEW
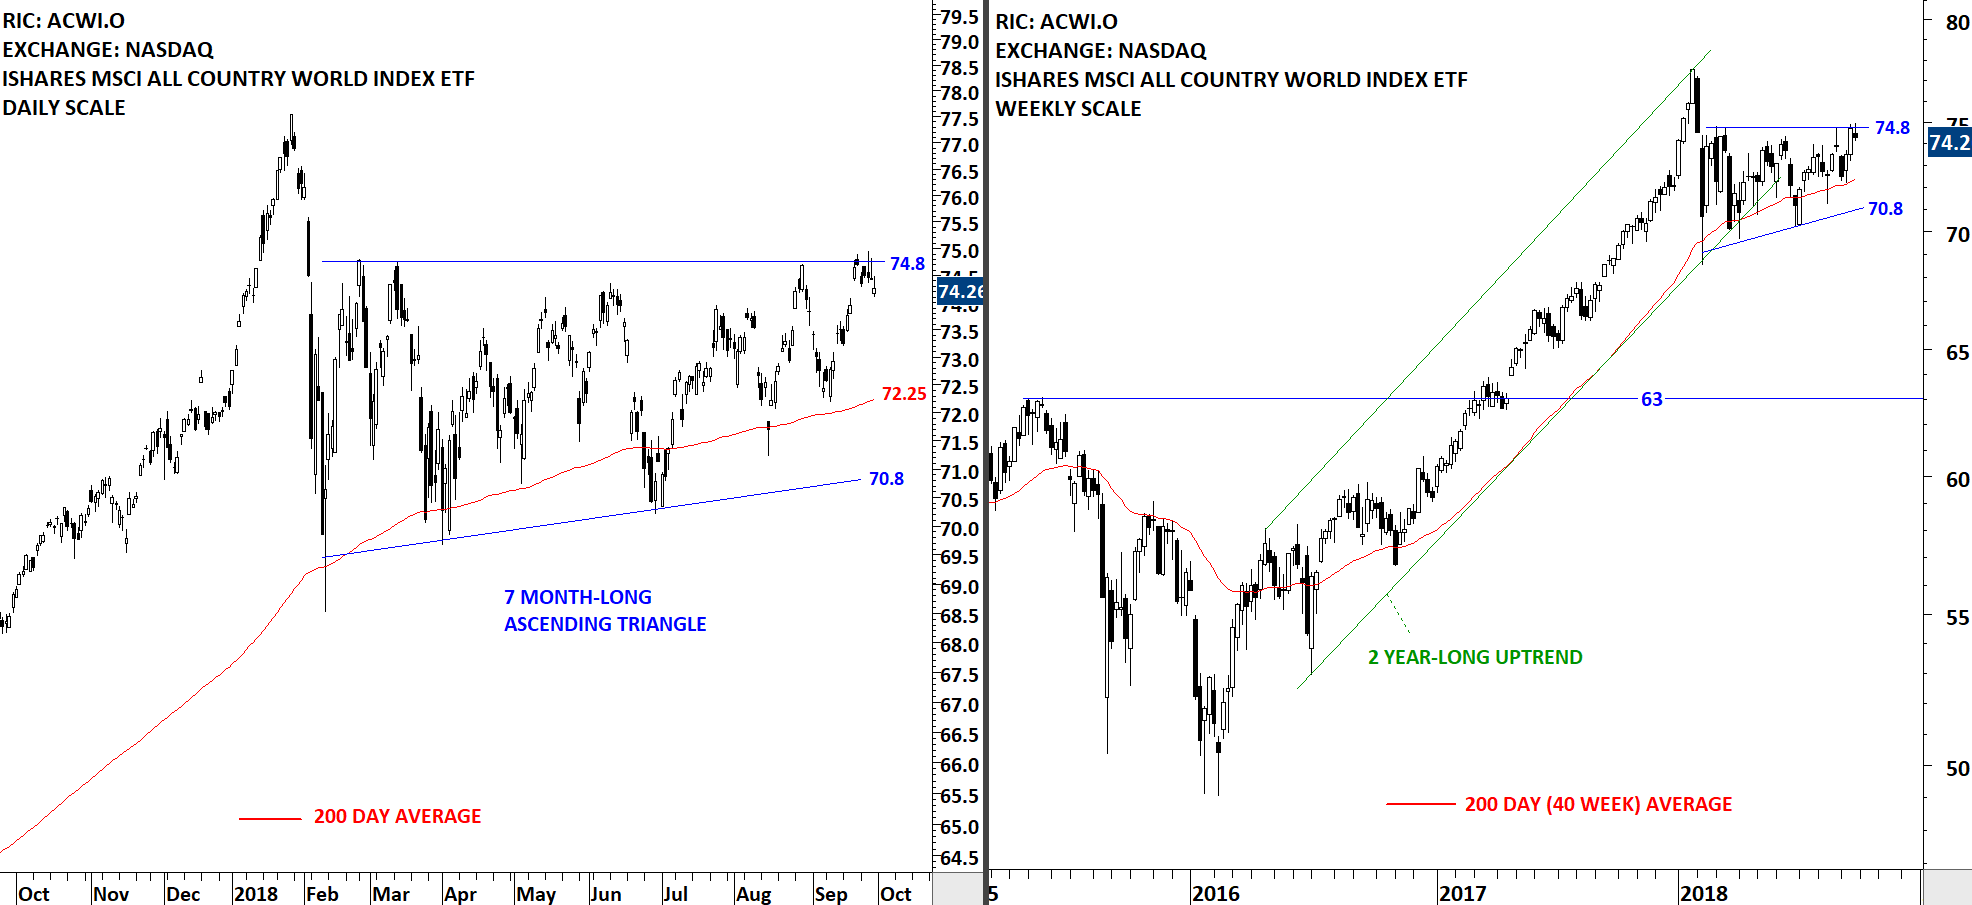
On Tuesday we had our members webinar and we discussed symmetrical triangles. We received very positive feedback from our members. A recorded version of the webinar will be uploaded on the website for our premium members. We will inform you via e-mail when it is on the Tech Charts website. During the Q&A section one of our members brought to my attention the possibility of labeling the symmetrical triangle chart pattern on the iShares MSCI All Country World Index ETF (ACWI.O) as an ascending triangle. Ascending triangle has a bullish bias when compared with a symmetrical triangle. Given that the price respected the horizontal resistance at 74.8, I labelled the chart below with the ascending triangle interpretation. It is important to note that Global equities performance as measured by the iShares MSCI All Country World Index ETF is going through an extreme low volatility period. Usually these type of low volatility periods are followed by strong directional movement. Price for the ACWI is still trading in a tight range between 70.8 and 74.8.
 Read More
