
GLOBAL EQUITY MARKETS – December 1, 2018
REVIEW
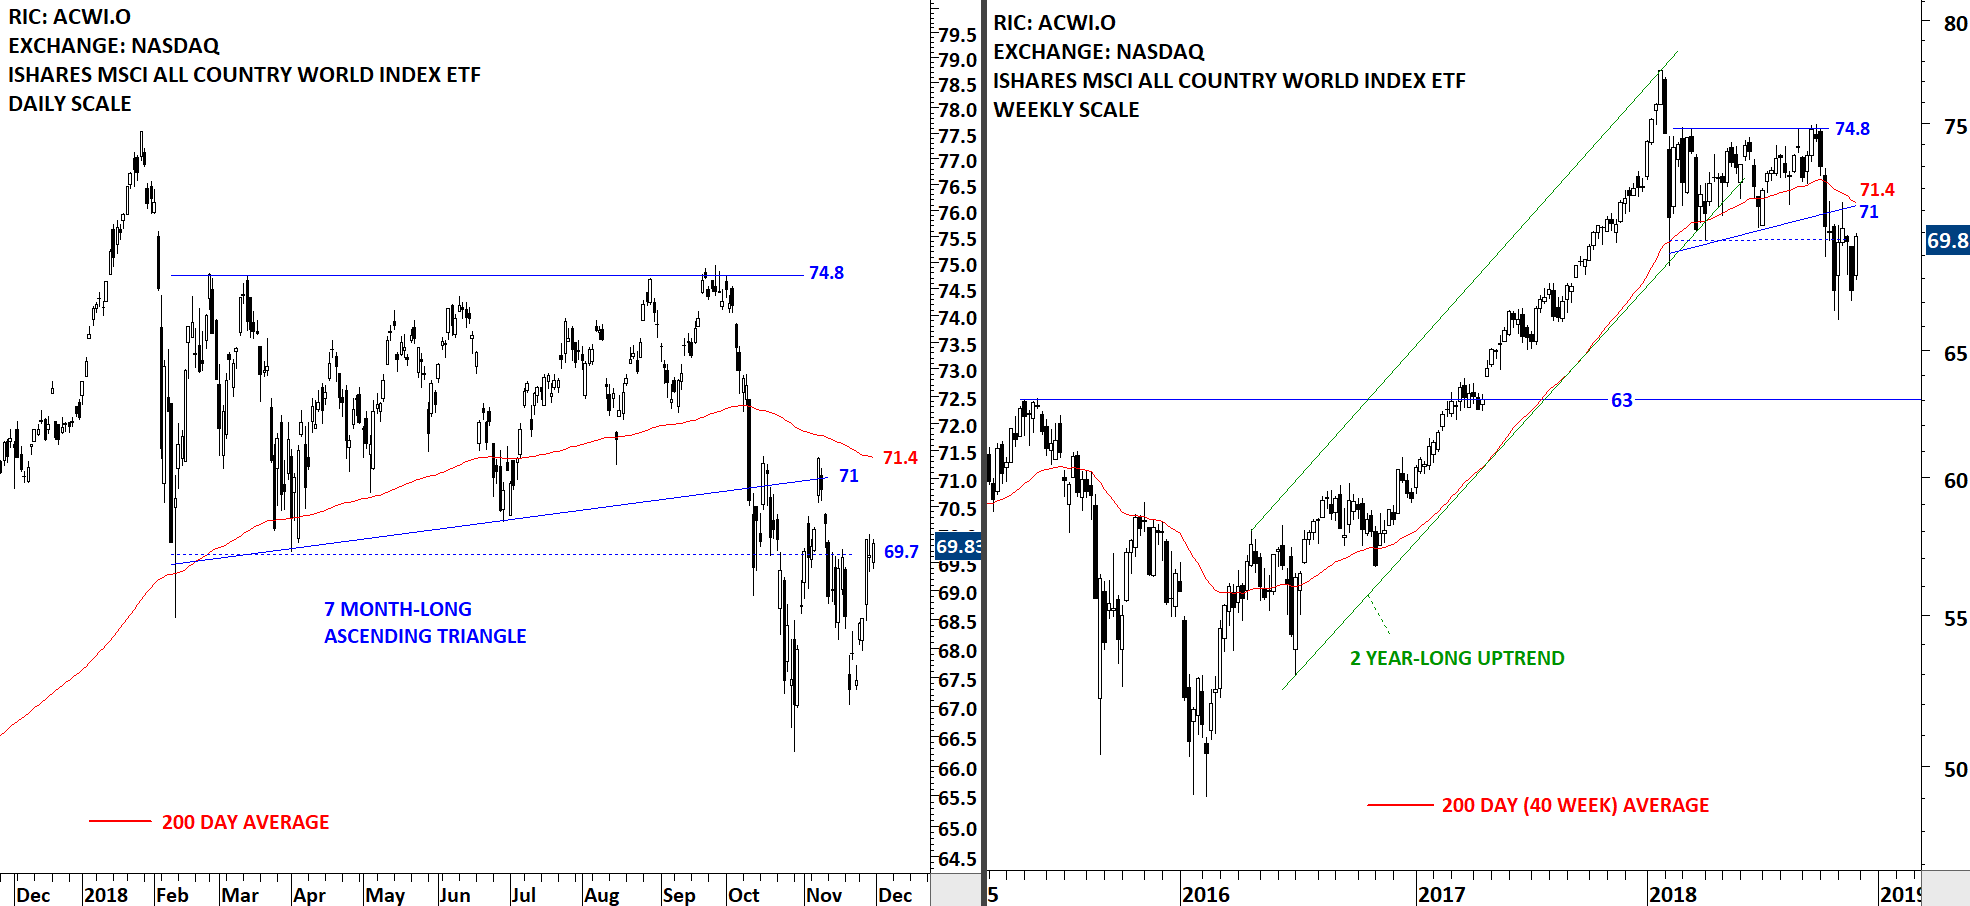
The iShares MSCI All Country World Index ETF (ACWI.O) continues to consolidate below its long-term average at 71.4 levels. 71-71.4 area will act as strong resistance for the Global equity benchmark. Over the past few months the ETF has been consolidating in a wide range between 66.5 and 71 levels. I use the 200-day moving average as a trend filter. Price action below the long-term average warns us of possible weakness (in the form of further choppy price action or continued downward momentum).
 Read More
GLOBAL EQUITY MARKETS – November 24, 2018
REVIEW
The longer the price remains below the long-term averages the more established that downtrend will become. The benchmark for the Global Equity Markets performance, iShares MSCI All Country World Index ETF (ACWI.O) broke down the lower boundary of its multi-month long consolidation and its long-term average around same time. Sharp sell-off was followed by a pullback to the chart pattern boundary. This week's price action resumed the downtrend. The minor low around October lows (66) will act as short-term support. Breakdown below the October lows can send the ACWI ETF towards the next support level at 63 levels. Strong resistance area remains between 71 and 71.5 levels. Until we see a recovery above the resistance area (71-71.5), we will expect the weakness to resume in the Global Equity Markets.
 Read More
GLOBAL EQUITY MARKETS – November 17, 2018
REVIEW
The benchmark for the Global Equity Markets performance, iShares MSCI All Country World Index ETF (ACWI.O) is trading below its long-term (200-day) average. Last one month's price action formed choppy and sideways consolidation. Earlier the ACWI ETF broke down its multi-month-long consolidation and ended a low volatility period. Volatility is cyclical. Low volatility begets high volatility and vice versa. Currently the ETF is consolidating its earlier sharp price decline from 75 to 66 levels. Strong resistance area is between 71 and 71.6 levels. Long-term support stands at 63 levels.
 Read More
