
Live Webinar and Q&A with Aksel – Thursday, January 10, 8:30am mountain
Dear Tech Charts Members,
We are continuing our Member webinar series with some of the frequently featured reversal chart patterns; the head and shoulder top, descending triangle and rectangle. Global equities entered into bear market territory. Over the past couple of months the Global Equity Markets report has featured great chart setups that were identified as top reversals. Identifying reversal chart patterns can help us in protecting downside in our portfolios. Liquid instruments also offer great shorting opportunities.
Scheduled for: Thursday, January 10th at 8:30am MST (register below)
The upcoming webinar is dedicated to a thorough discussion on head and shoulder top, descending triangle and rectangle as top reversal chart patterns.- We will review some of those chart pattern breakdowns that were featured in the Global Equity Markets report.
- We will review some of the qualities we look for when identifying reversal chart patterns
- We will look at some of the developing top formations.
- We will continue to highlight Tech Charts members favorite chart pattern setups in different equity markets. As always please feel free to send charts for discussion.
- We will have a member Q&A at the end of the webinar.

GLOBAL EQUITY MARKETS – December 29, 2018
Dear Tech Charts members,
One more year is behind us. In the beginning of every year I wish health for family members, friends and their loved ones. Tech Charts community has become a family. I wish all of you a healthy New Year. I hope the new year brings new hopes and aspirations along with the zeal and courage to keep up with those commitments. Wish you all the best.
Kind regards,
![]()
REVIEW
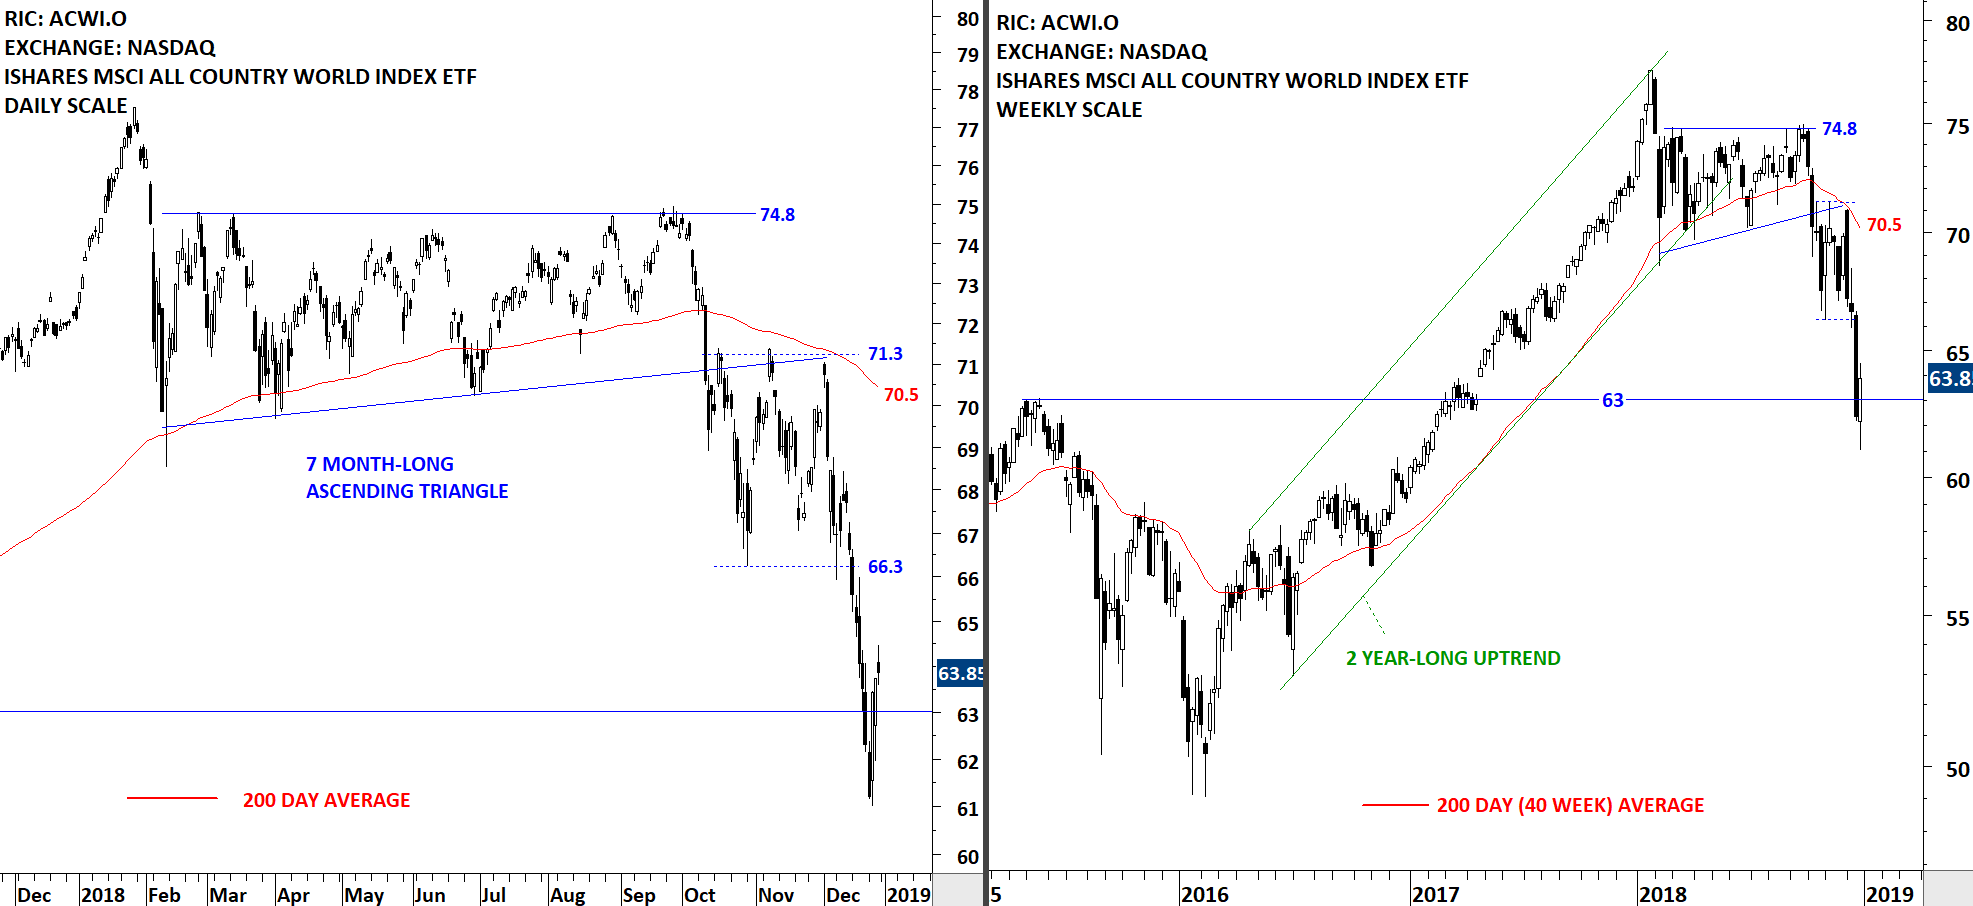
Global equity markets performance as measured by the iShares MSCI All Country World Index ETF (ACWI.O) rebounded from oversold levels. In the time frame I analyze price charts (daily, weekly and monthly) from a classical charting perspective there is no clear sign of reversal. V bottoms can take place and they are usually difficult to anticipate and analyze. My best guess is that we see some sort of consolidation after December's sharp sell-off. The consolidation can result in a re-test of previous lows. We will be able to tell as we get new evidence (data points) from the markets. For now I can say that the ACWI ETF (ACWI.O) stabilized around the support at 63 levels. Strong resistance stands at 66.3 levels. The ETF is trading below its long-term average and is in a steady downtrend.
 Read More
GLOBAL EQUITY MARKETS – December 22, 2018
REVIEW
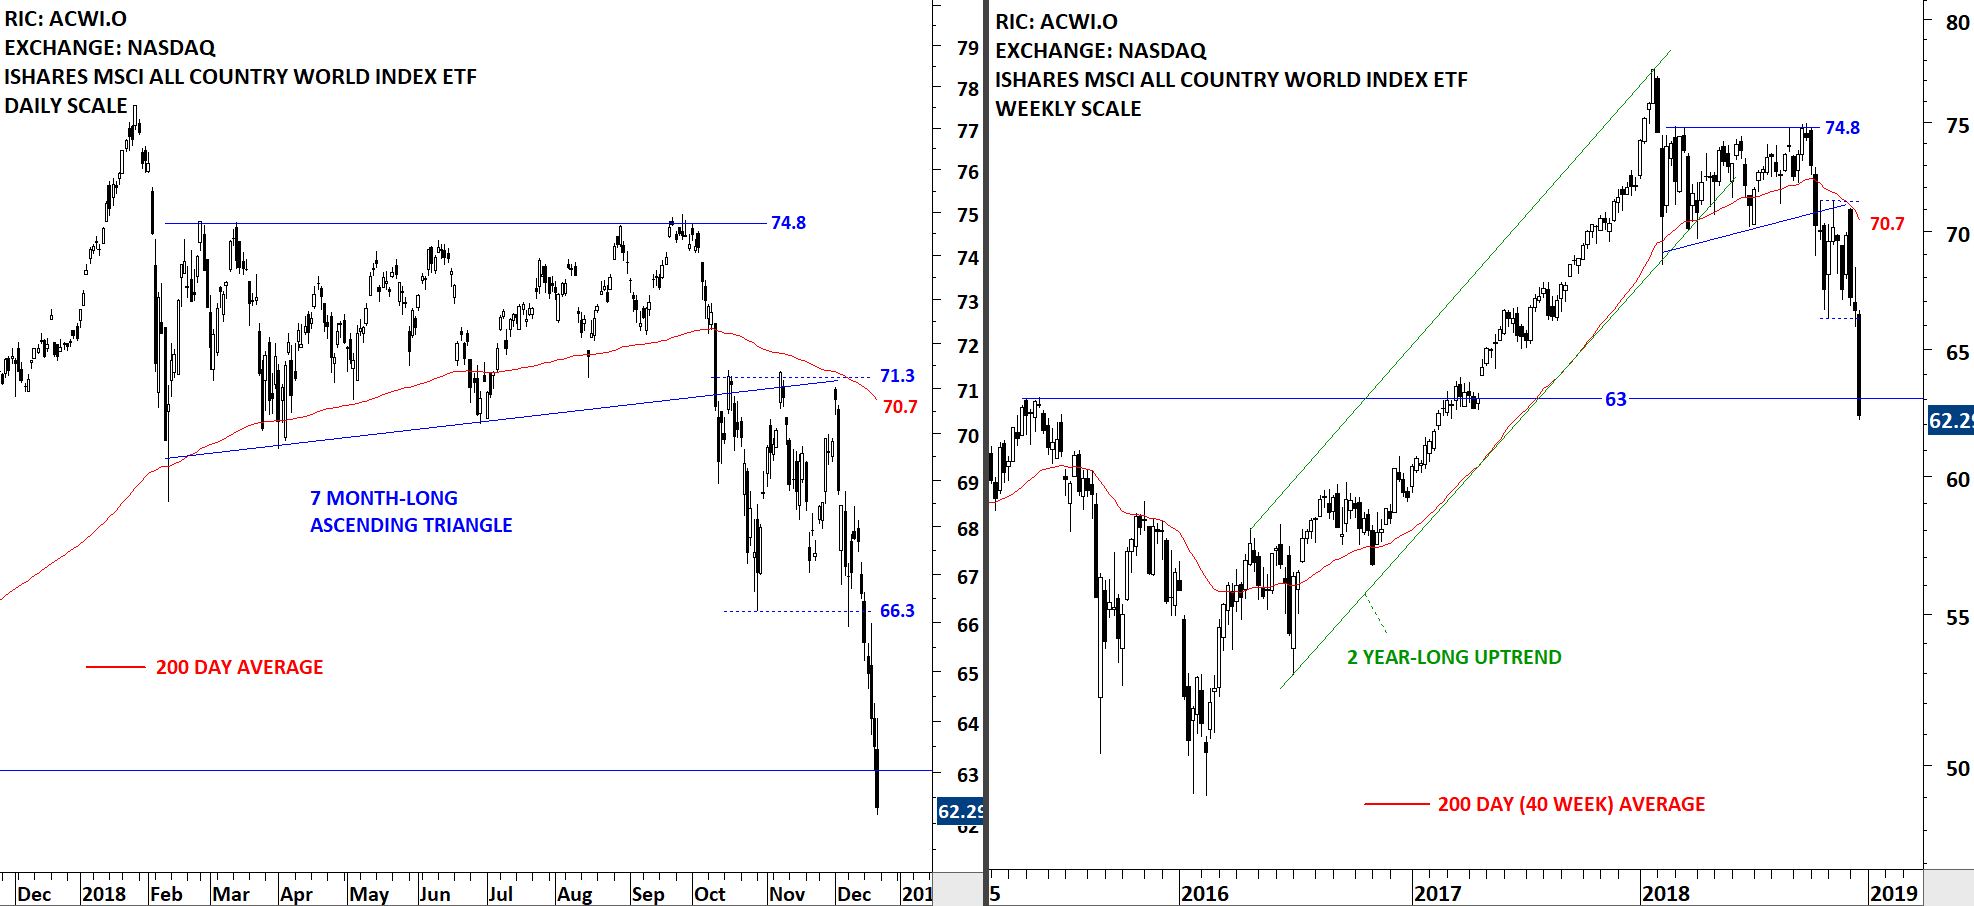
Global equity markets performance as measured by the iShares MSCI All Country World Index ETF (ACWI.O) broke down the 3 month-long sideways consolidation by breaching the support at 66.3 levels. Breakdown was followed by a sharp drop towards the next support level at 63 levels. Nothing good happens below the 200-day moving average. Back in October the long-term trend following indicator alerted us to the change in trend. Previous support becomes the new resistance. 66.3 levels will act as short-term resistance if markets experience any rebound. In the short-term, there is no chart pattern that would signal a trend reversal.
 Read More
