
GLOBAL EQUITY MARKETS – February 9, 2019
REVIEW
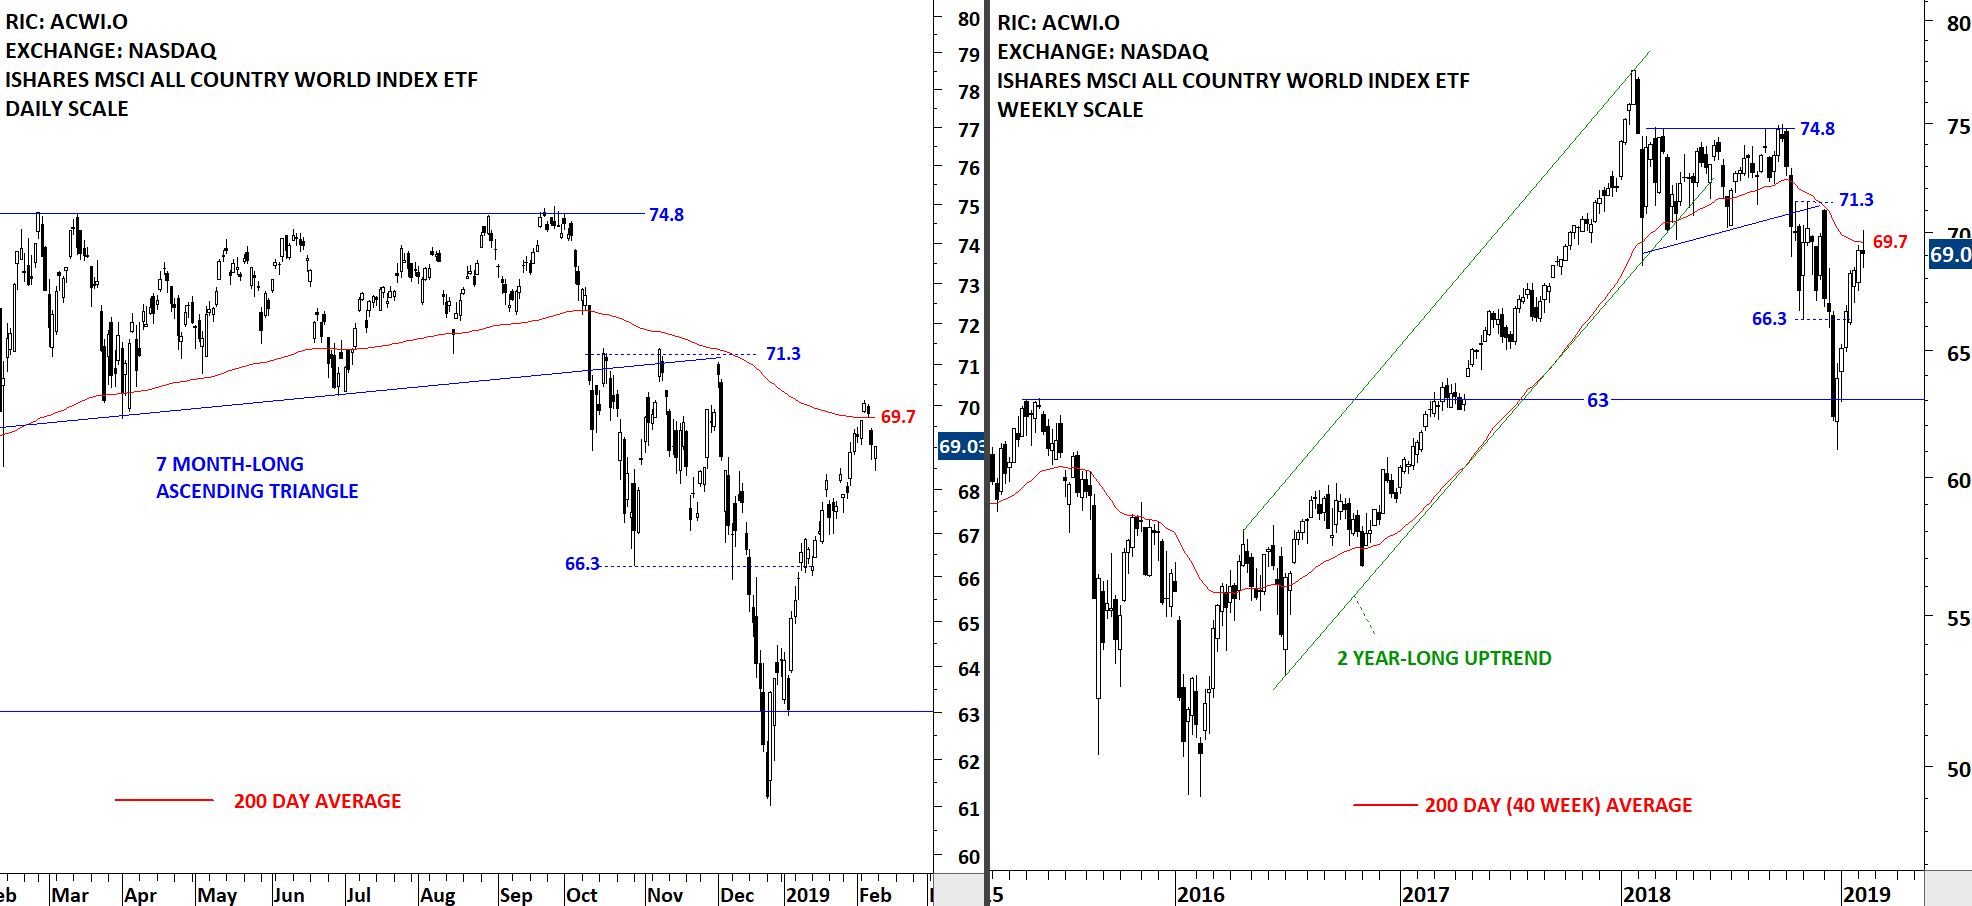
The benchmark for the Global equity markets performance, the iShares MSCI All Country World Index ETF (ACWI.O), found resistance at the 200-day moving average. After a sharp rebound from the support area (63 levels), the long-term 200-day moving average was the first important resistance the ETF faced. During any consolidation around the 200-day average or during a pullback, I will be looking for a bullish continuation chart pattern development. For bullish interpretation and a reversal of the downtrend, I would like to see the ETF stabilizing above its long-term average. A good example is the first half of 2016...
 Read More
GLOBAL EQUITY MARKETS – February 2, 2019
REVIEW
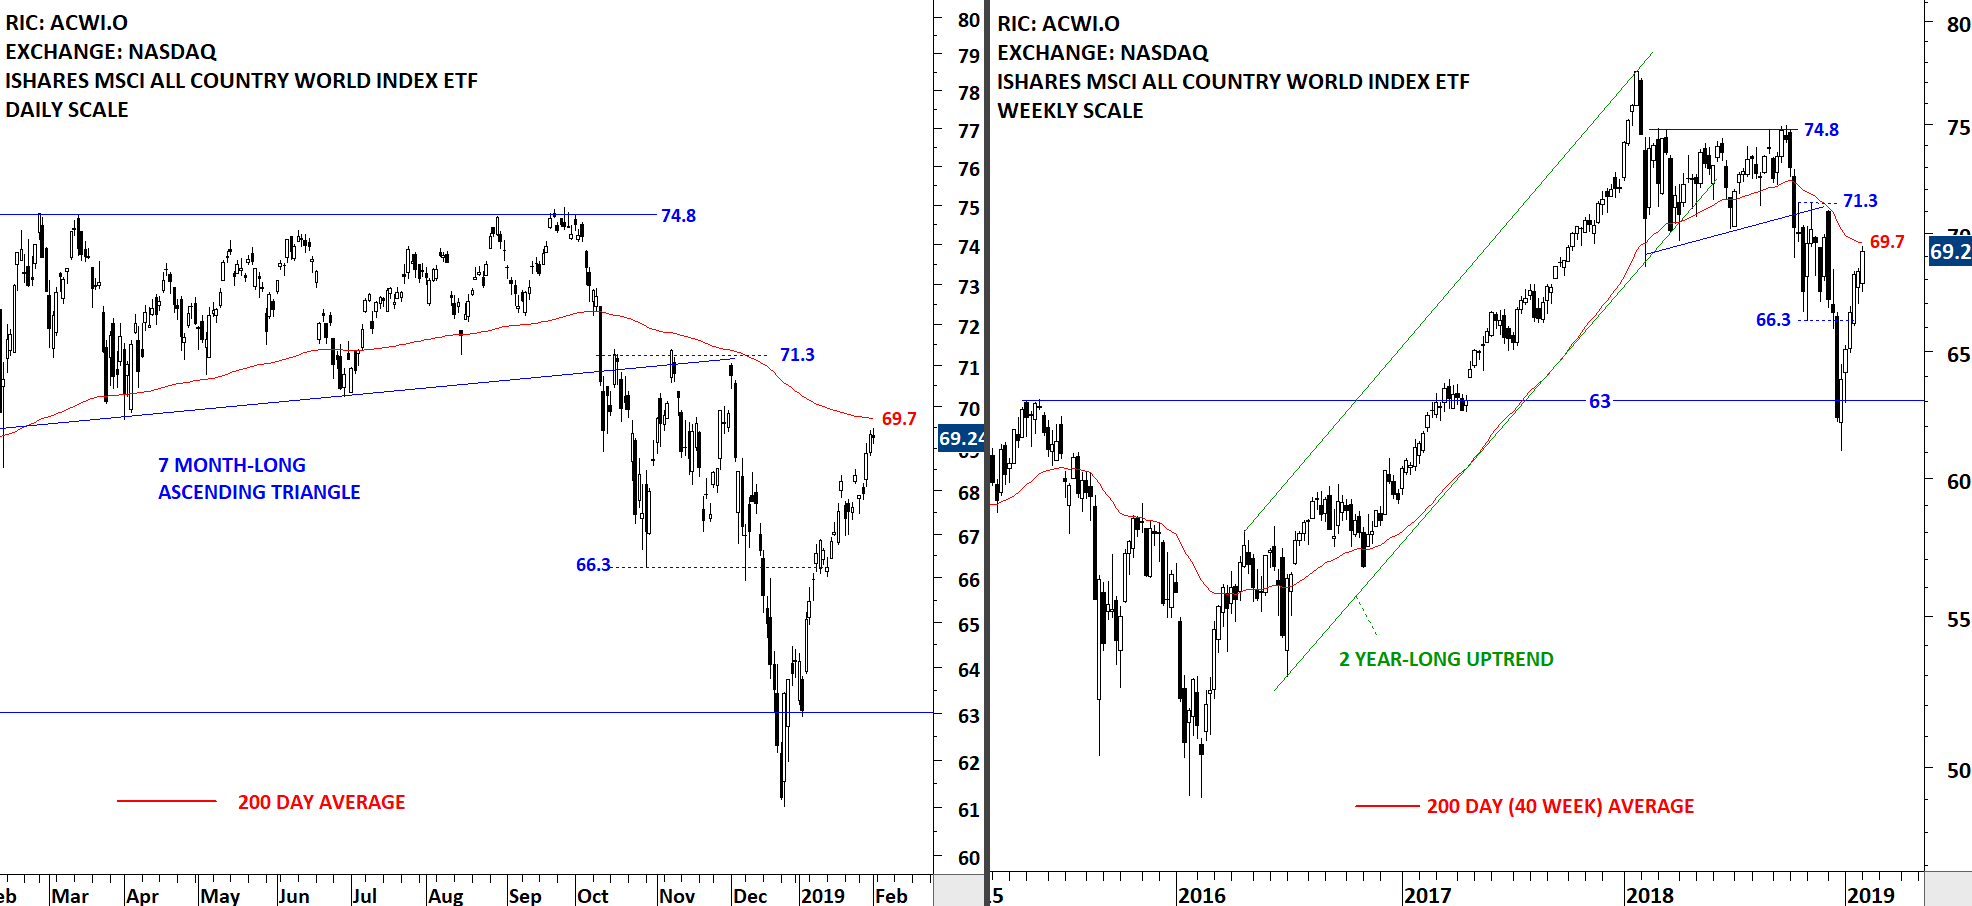
The benchmark for the Global Equity markets performance, the iShares MSCI All Country World Index ETF (ACWI.O) reached its 200-day moving average after a strong rebound from the support at 63 levels. Back to back weekly gains pushed the index towards the resistance level I follow and utilize as a trend filter. I consider price action above the long-term average as strong and expect higher levels. Price action below the long-term average shows weakness and can become part of a larger scale downtrend. Both daily and weekly scale price chart for the ACWI ETF hasn't provided a well-defined chart pattern.
 Read More
GLOBAL EQUITY MARKETS – January 26, 2019
REVIEW
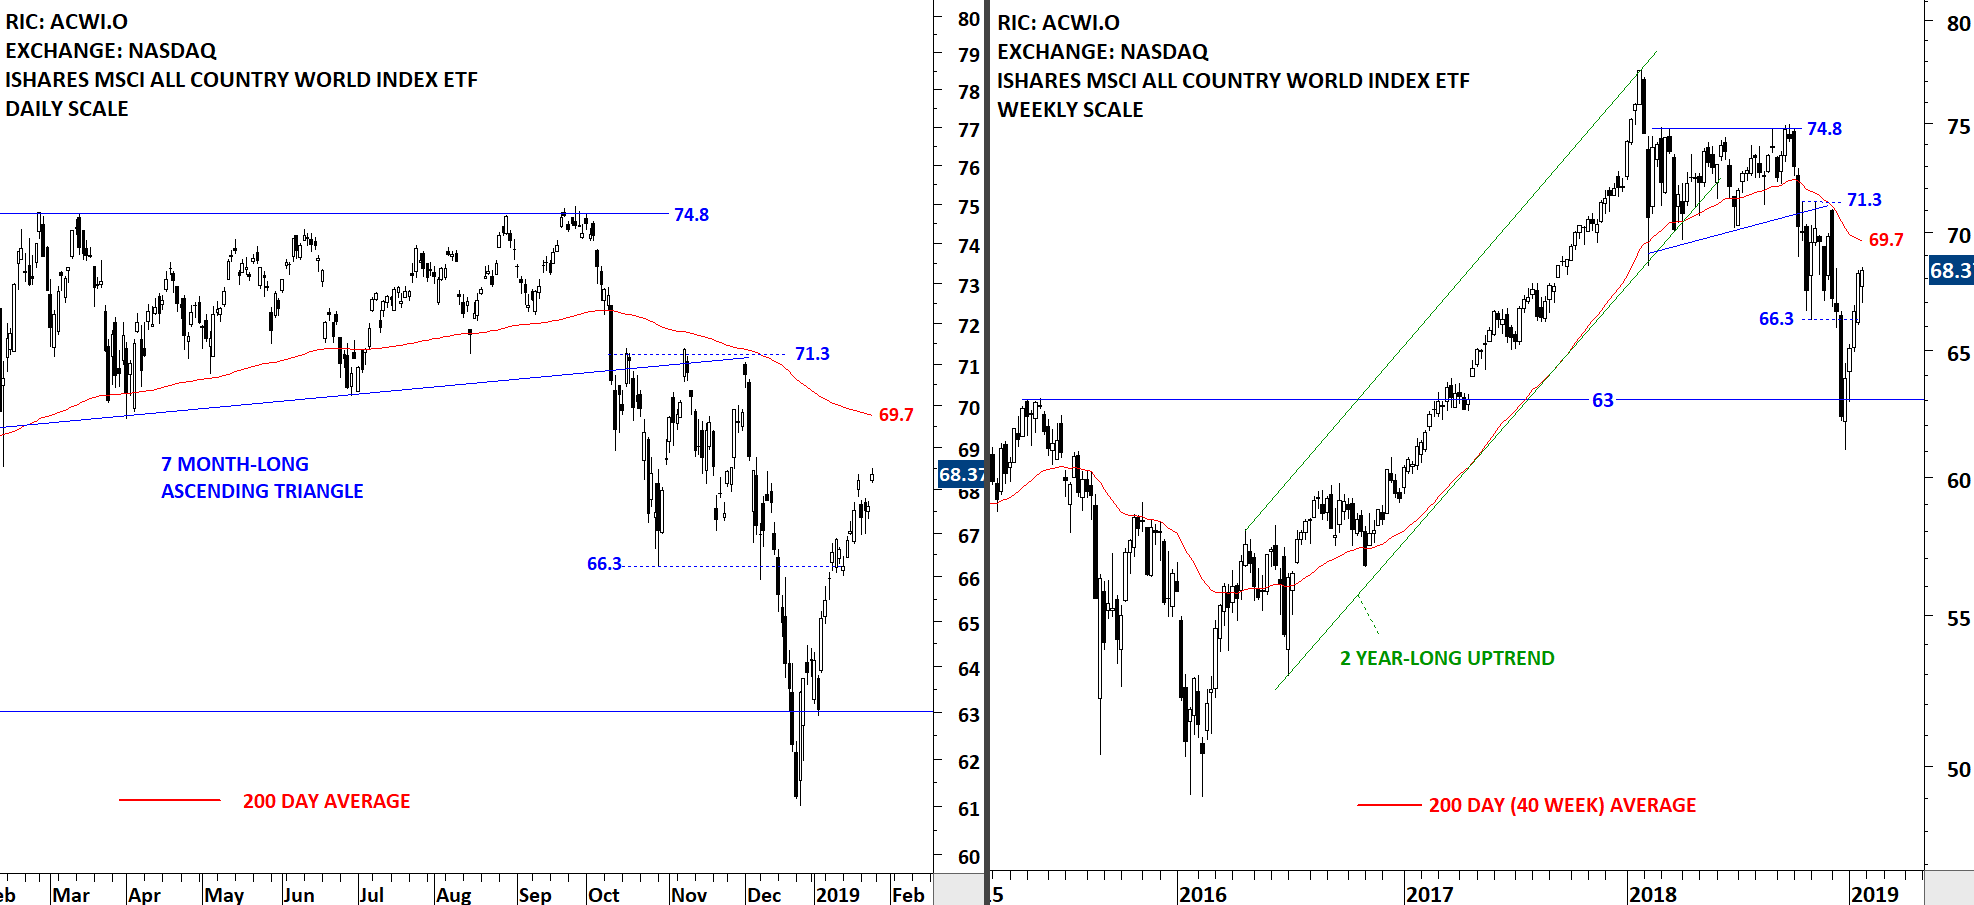
The benchmark for Global equity markets performance, iShares MSCI All Country World Index ETF (ACWI.O) had a strong rebound from the support level at 63 levels. V-reversal pushed the ETF towards its long-term moving average at 69.7 levels. In the last quarter of 2018, the ETF broke down its 7 month-long consolidation and started a corrective period. Over the past 5 weeks the ETF had back to back gains that recovered most of December 2018 losses without any pullback. Latest rebound might be due for a short pullback. I will be looking for bullish chart pattern developments to find low risk entry points.
Friday's price action was a gap opening. Below I analyze two gap openings on the iShares MSCI Emerging Markets ETF (EEM) and the iShares MSCI All Country World Index ETF (ACWI.O).
 Read More
