
GLOBAL EQUITY MARKETS – February 23, 2019
REVIEW
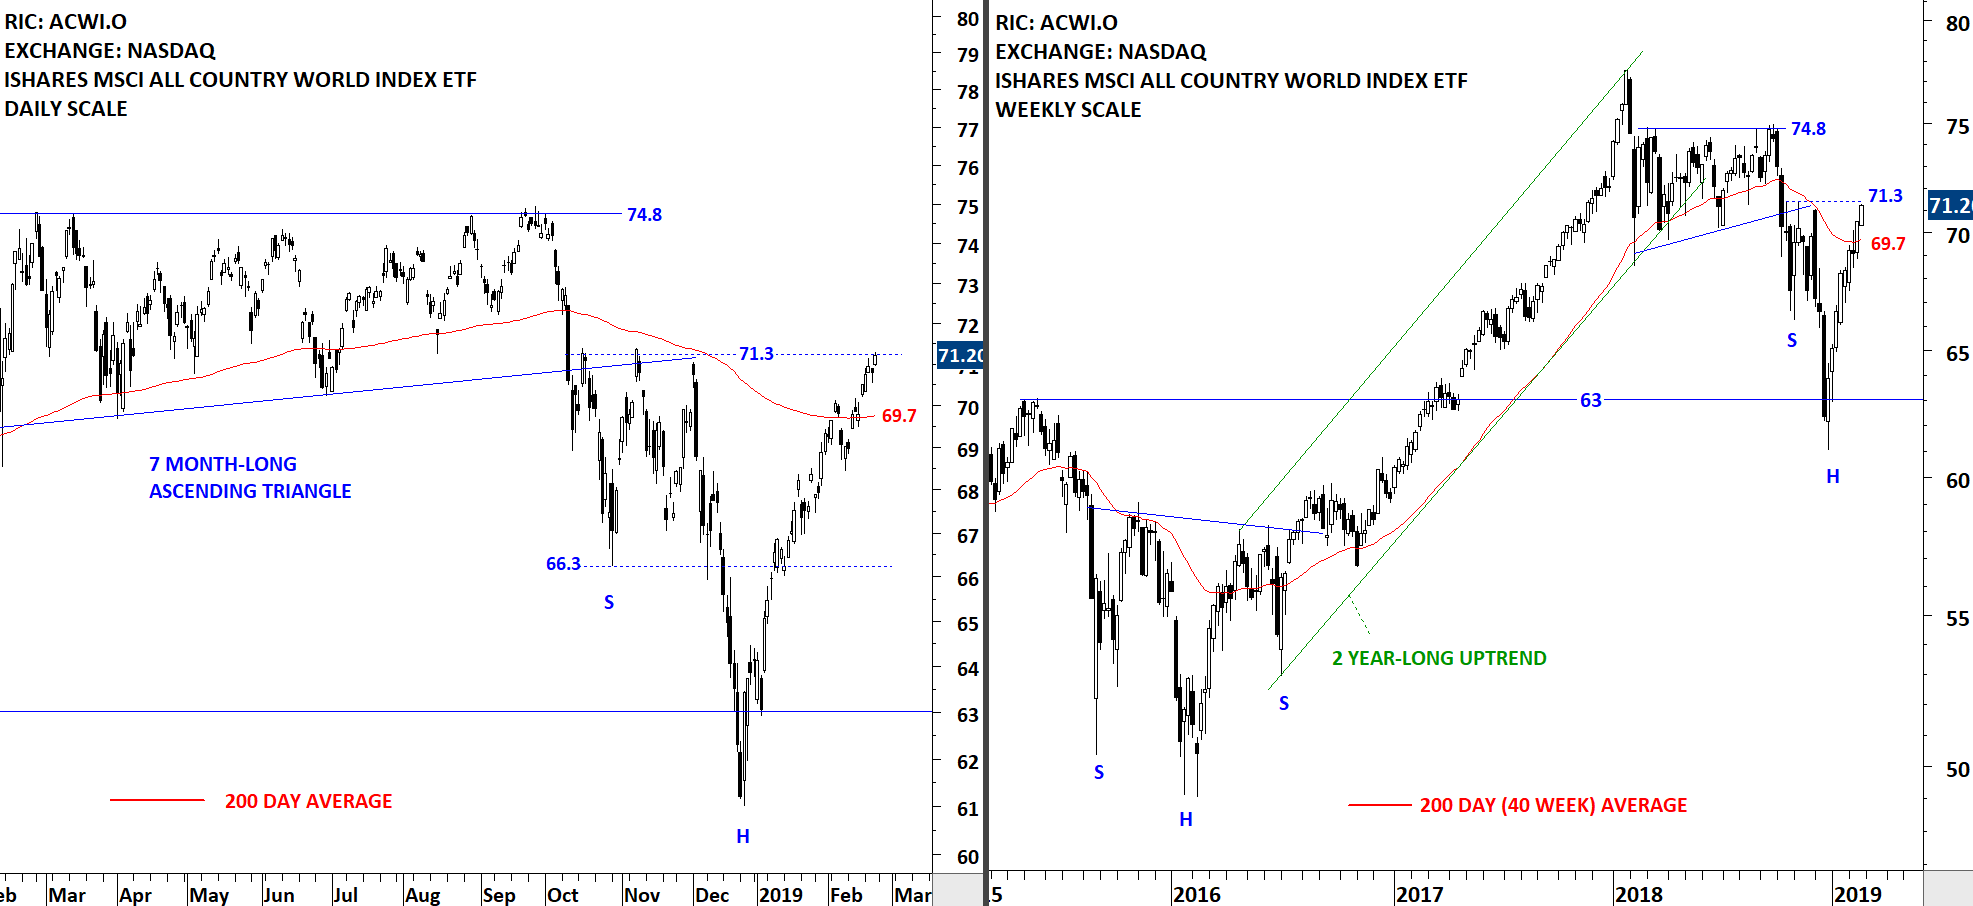
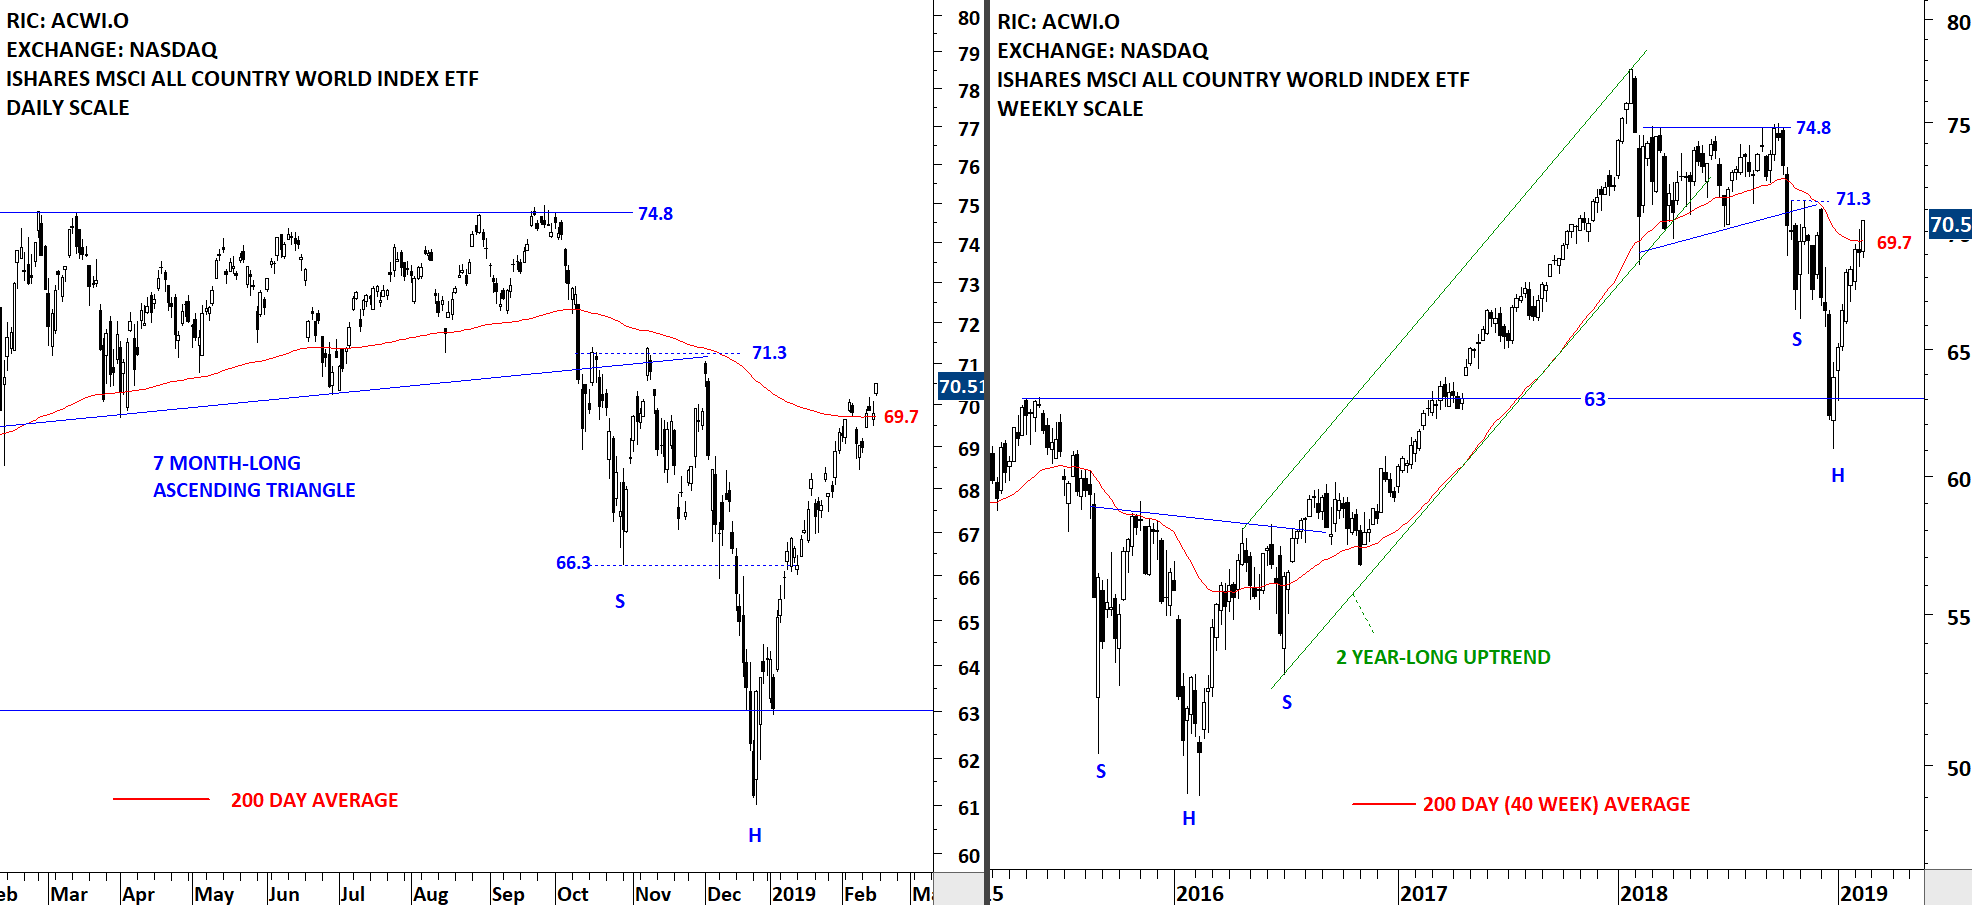
The benchmark for the Global equity markets performance the iShares MSCI All Country World Index ETF is testing the resistance level at 71.3 levels. Since the beginning of the year the ETF had a strong run towards the 200-day moving average. Over the past two weeks the ETF cleared its long-term average. If there is a pullback, the 200-day moving average will act as a support around 69.7 levels. Price action above the long-term average should be considered bullish and could signal a change in trend.
 Read More
INTERIM UPDATE – February 19, 2019
As part of our usual communication and e-mail exchange with Tech Charts members, I got the request to review metal miners. During my research on Philadelphia SE Gold/Silver Index constituents I came across this chart pattern setup which is slightly in longer duration that I feature in the reports (3 months-24 months). However, I think the developing chart pattern is worth bringing to your attention. Read More

GLOBAL EQUITY MARKETS – February 16, 2019
REVIEW
The benchmark for the Global equity markets performance, the iShares MSCI All Country World Index ETF had another strong week pushing the ETF above its 200-day (40-week) moving average. Back to back weekly gains followed the V-bottom reversal from the support level at 63. I think we are likely to see some sort of consolidation around the long-term average. Given the uninterrupted advance from January lows, a short-term pullback can possibly form the right shoulder of a H&S bottom formation. Please note it is still early to call for such development. I want to highlight this possibility as many other benchmarks are forming similar structures. For a good example of a consolidation around the long-term average, you can check the H&S bottom formation in 2016.
 Read More
