
GLOBAL EQUITY MARKETS – March 16, 2019
REVIEW
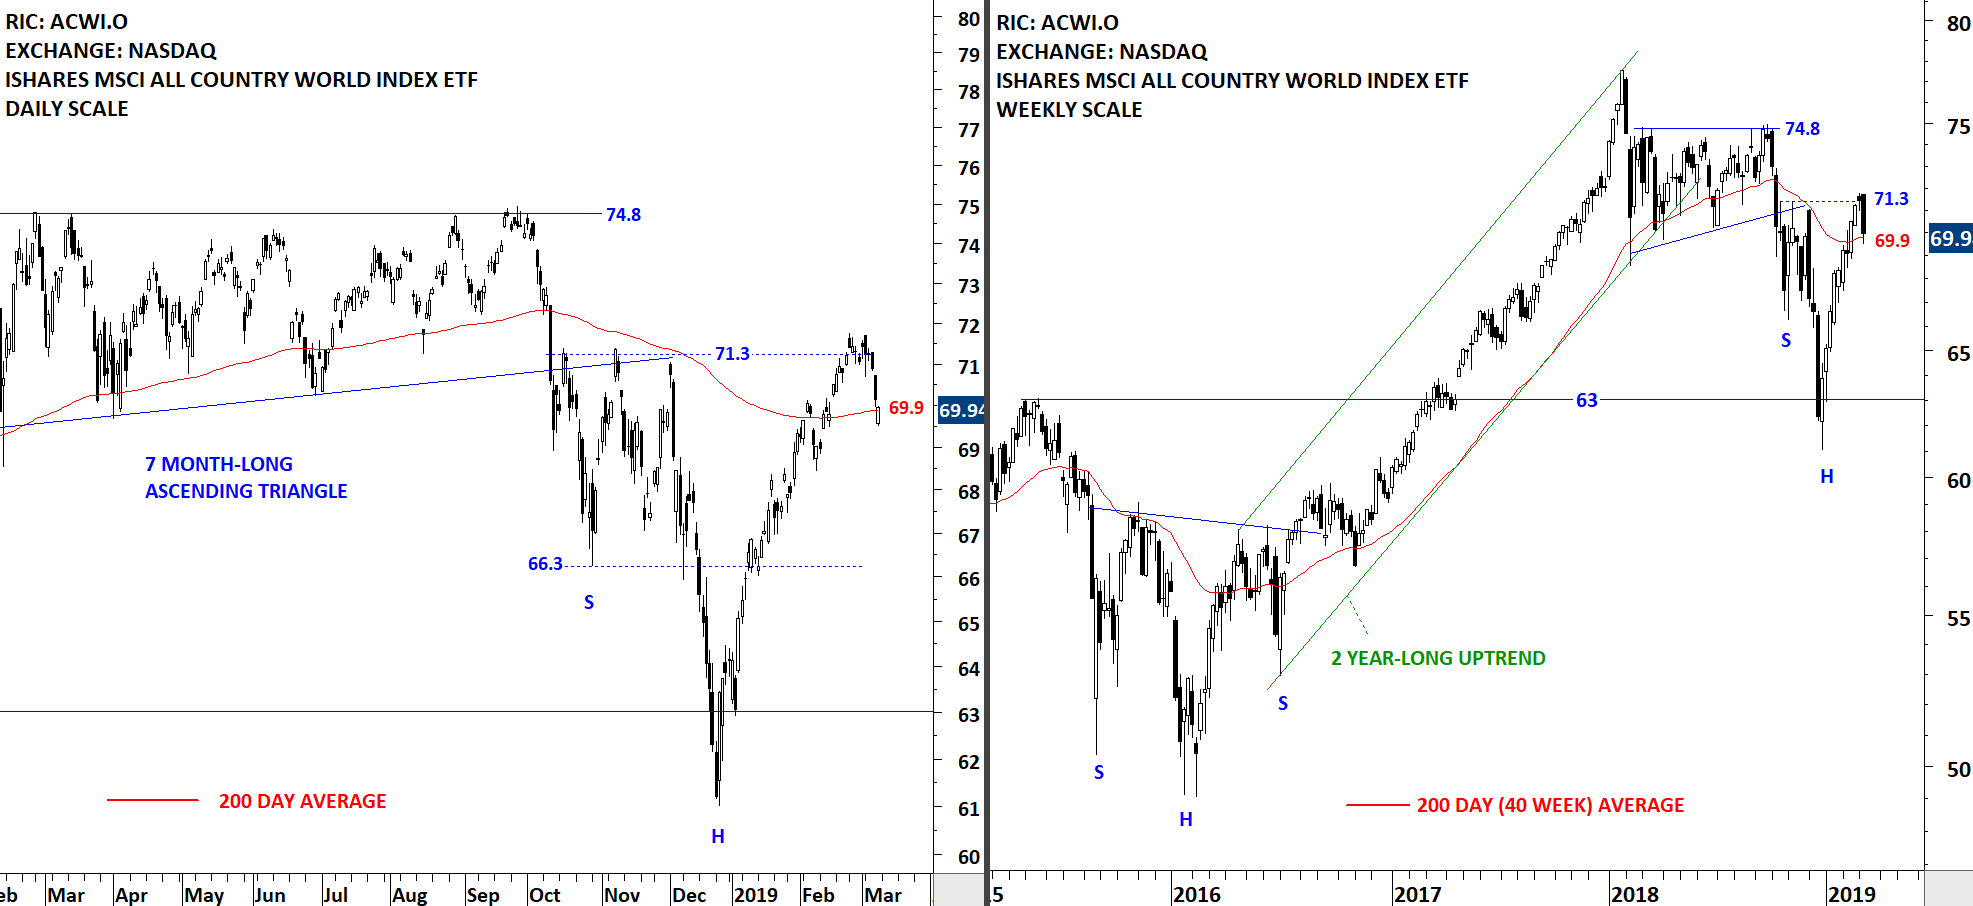
The benchmark for the Global equity markets performance, the iShares MSCI All Country World Index ETF (ACWI.O) found support above its 200-day (40 week) average. Sharp V-reversal from the low of January 2019 didn't encounter a pullback/correction. I analyze the price action that manages to consolidate and find support above its long-term average as positive and review the ACWI ETF with a bullish bias. During any pullback or further sideways consolidation, the 200-day moving average at 69.9 levels will act as support.
 Read More
GLOBAL EQUITY MARKETS – March 9, 2019
REVIEW
The benchmark for the Global equity markets performance, the iShares MSCI All Country World Index ETF (ACWI.O) found resistance at 71.3 levels. Strong rebound that started in the beginning of January is now being interrupted with a correction. This week's price action tested the 200-day moving average. We are likely to see more choppy price action around the 200-day average, possibly in an attempt to form a reversal chart pattern. It is still early to call for the developing chart pattern a head and shoulders reversal. ACWI ETF is now in a trading range between 66.3 and 71.3 levels.
 Read More
GLOBAL EQUITY MARKETS – March 2, 2019
REVIEW
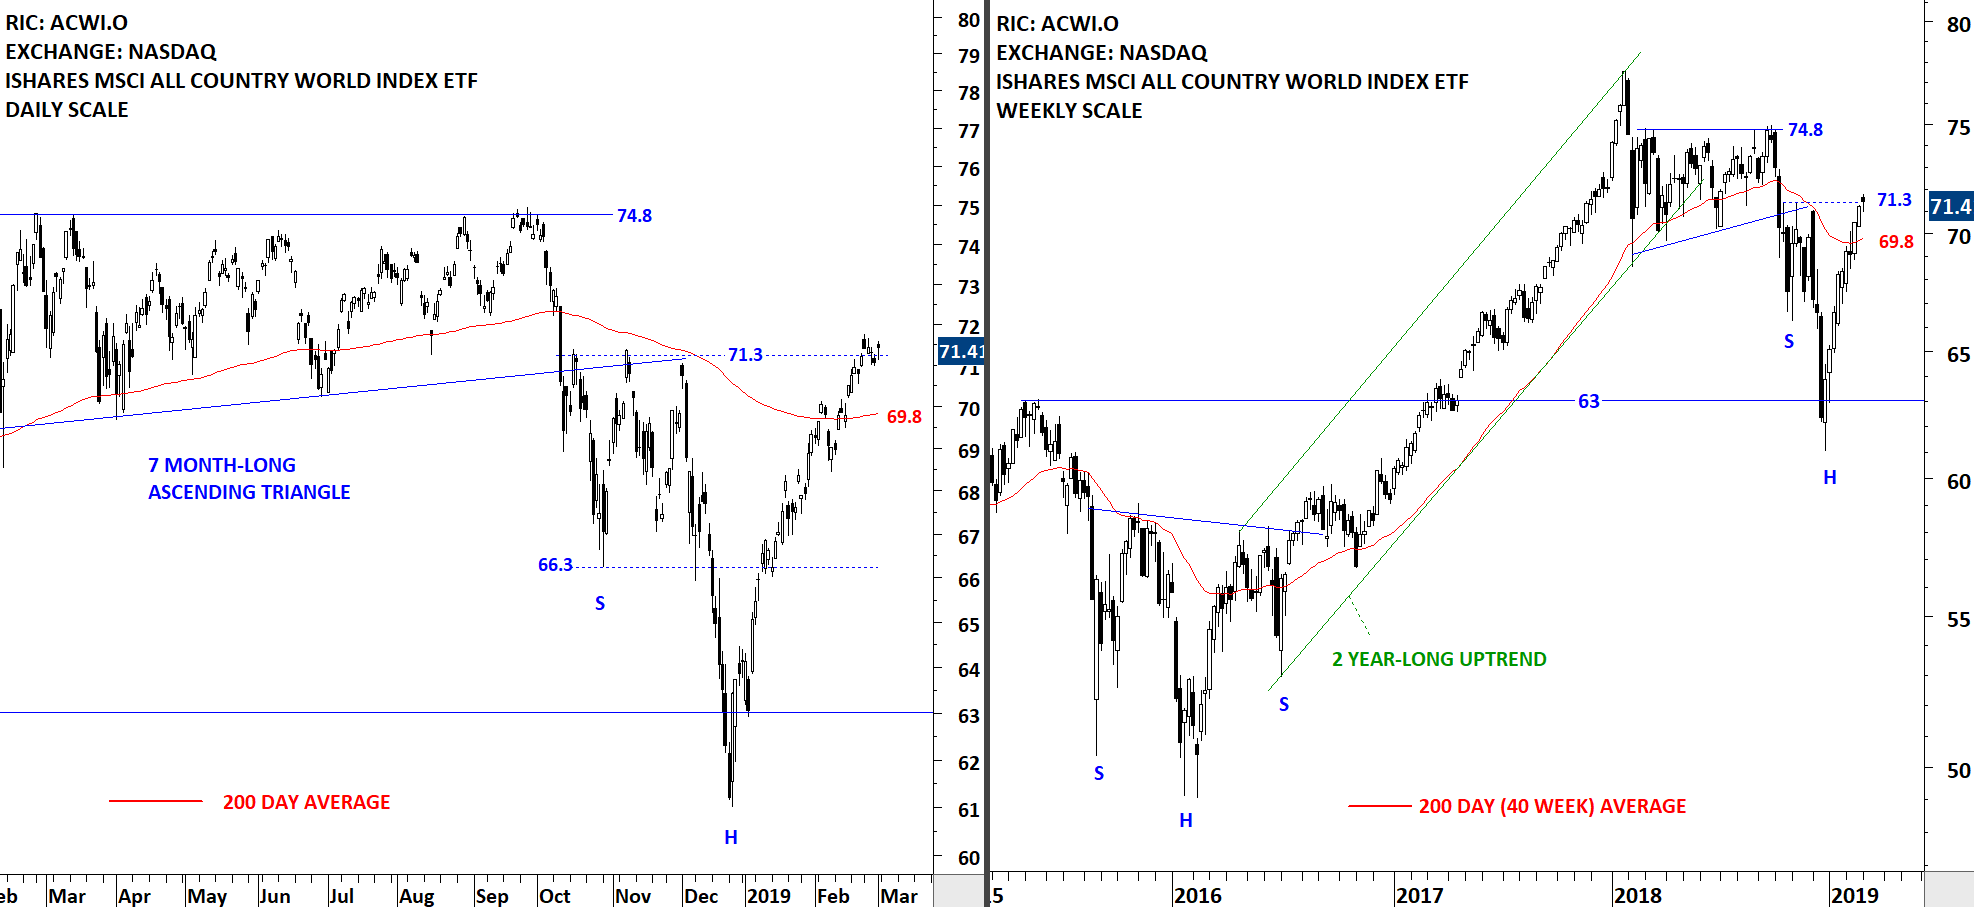
The benchmark for the Global equity markets performance, the iShares MSCI All Country World Index ETF remains above its long-term 200-day moving average. The ETF is now testing a minor resistance level at 71.3. The rebound from January lows has been strong and without any correction. A possible correction can result in a pullback to test the 200-day moving average at 69.8 levels. With the price remaining above the long-term average, the technical outlook has turned positive.
 Read More
