
GLOBAL EQUITY MARKETS – March 30, 2019
REVIEW
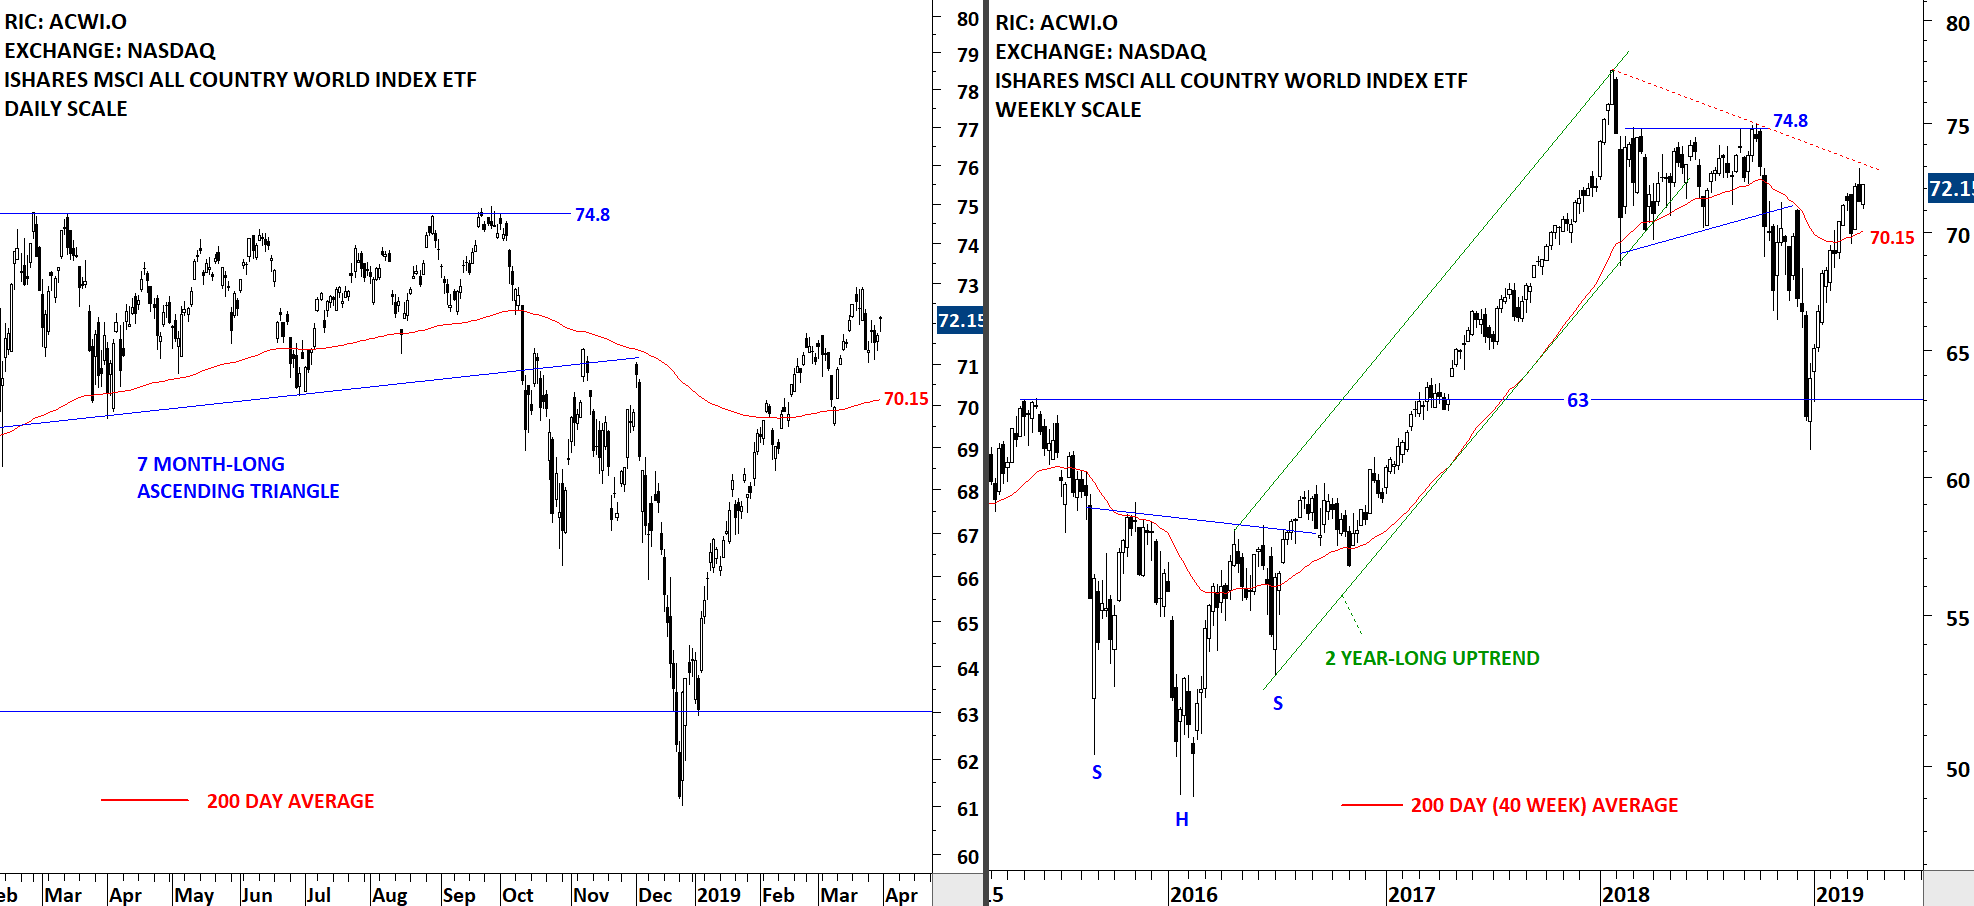
The benchmark for the Global equity markets performance, the iShares MSCI All Country World Index ETF (ACWI.O) is trying to find direction above its long-term average. We can see choppy price action around the 200-day average. More important is how the index will consolidate around the average. If it forms an orderly, recognizable short-term consolidation (in the form of a flag, pennant, rectangle, symmetrical triangle) I will conclude that the index is preparing for a new leg up. 200-day moving average is forming support at 70.15 levels.
 Read More
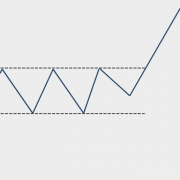
INTERIM UPDATE – March 29, 2019
One of my daily tasks is to go through +/- 2,000 names in search for well-defined classical chart patterns. I do this throughout the week. I disconnect from the markets during trading hours and run my research. As the weekend nears, I start finalizing new additions to the watchlist section of the weekly report. I like to inform members ahead of breakouts letting enough time to run their own due diligence on the companies discussed.
The chart below was part of the upcoming report's watchlist. However, it seems like there is a possibility of a breakout prior to the weekend. I think it is important for our members to be informed about this chart setup.
Read More
GLOBAL EQUITY MARKETS – March 23, 2019
REVIEW
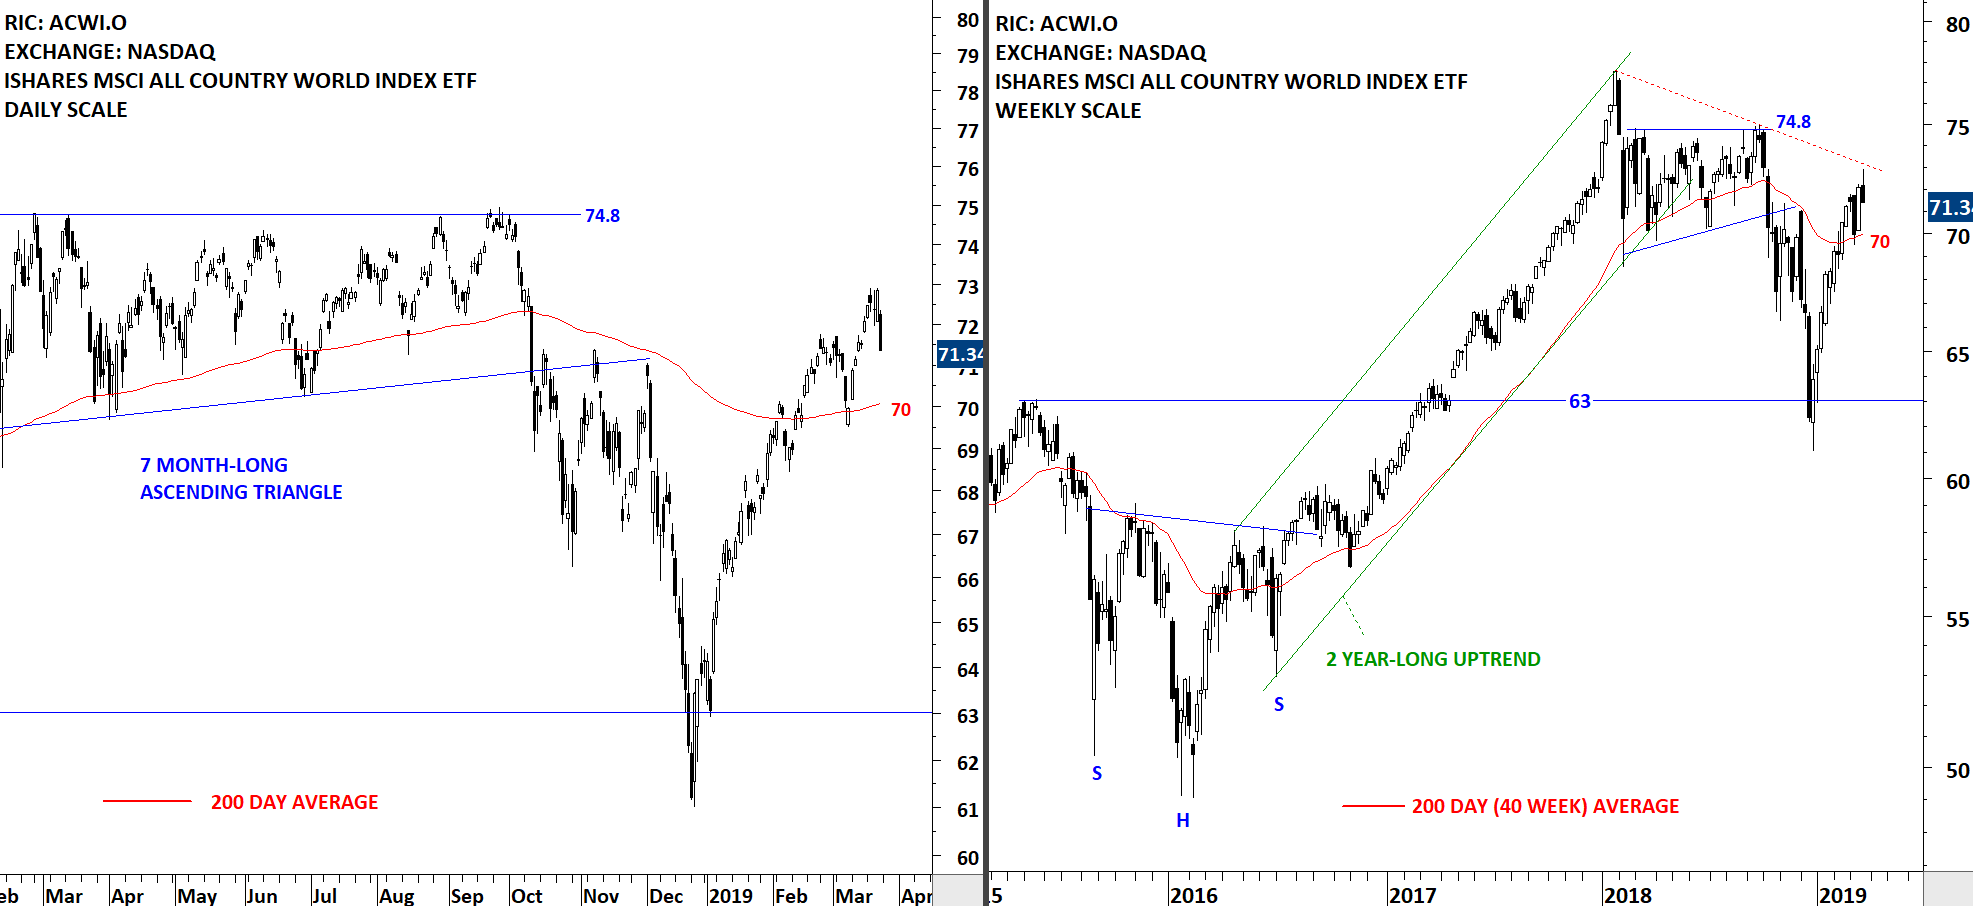
The benchmark for the Global equity markets performance the iShares MSCI All Country World Index ETF (ACWI.O) is trying to find direction above its long-term average. In March the index pulled back to the 200-day average and rebounded. Past few day's trading once again pulled the index towards the long-term average that can act as support around 70 levels. We can see choppy price action around the 200-day average. More important is how the index will consolidate around the average. If it forms an orderly, recognizable short-term consolidation (in the form of a flag, pennant, rectangle, symmetrical triangle) I will conclude that the index is preparing for a new leg up. Price action in 2016 is a good explanation of what I would like to see around the 200-day average to call for a change in trend. (A sharp drop, followed by a strong rebound that breaches the 200-day average, followed by choppy price action in search of a new trend and eventually forming a recognizable chart pattern)
 Read More
