
GLOBAL EQUITY MARKETS – April 20, 2019
REVIEW
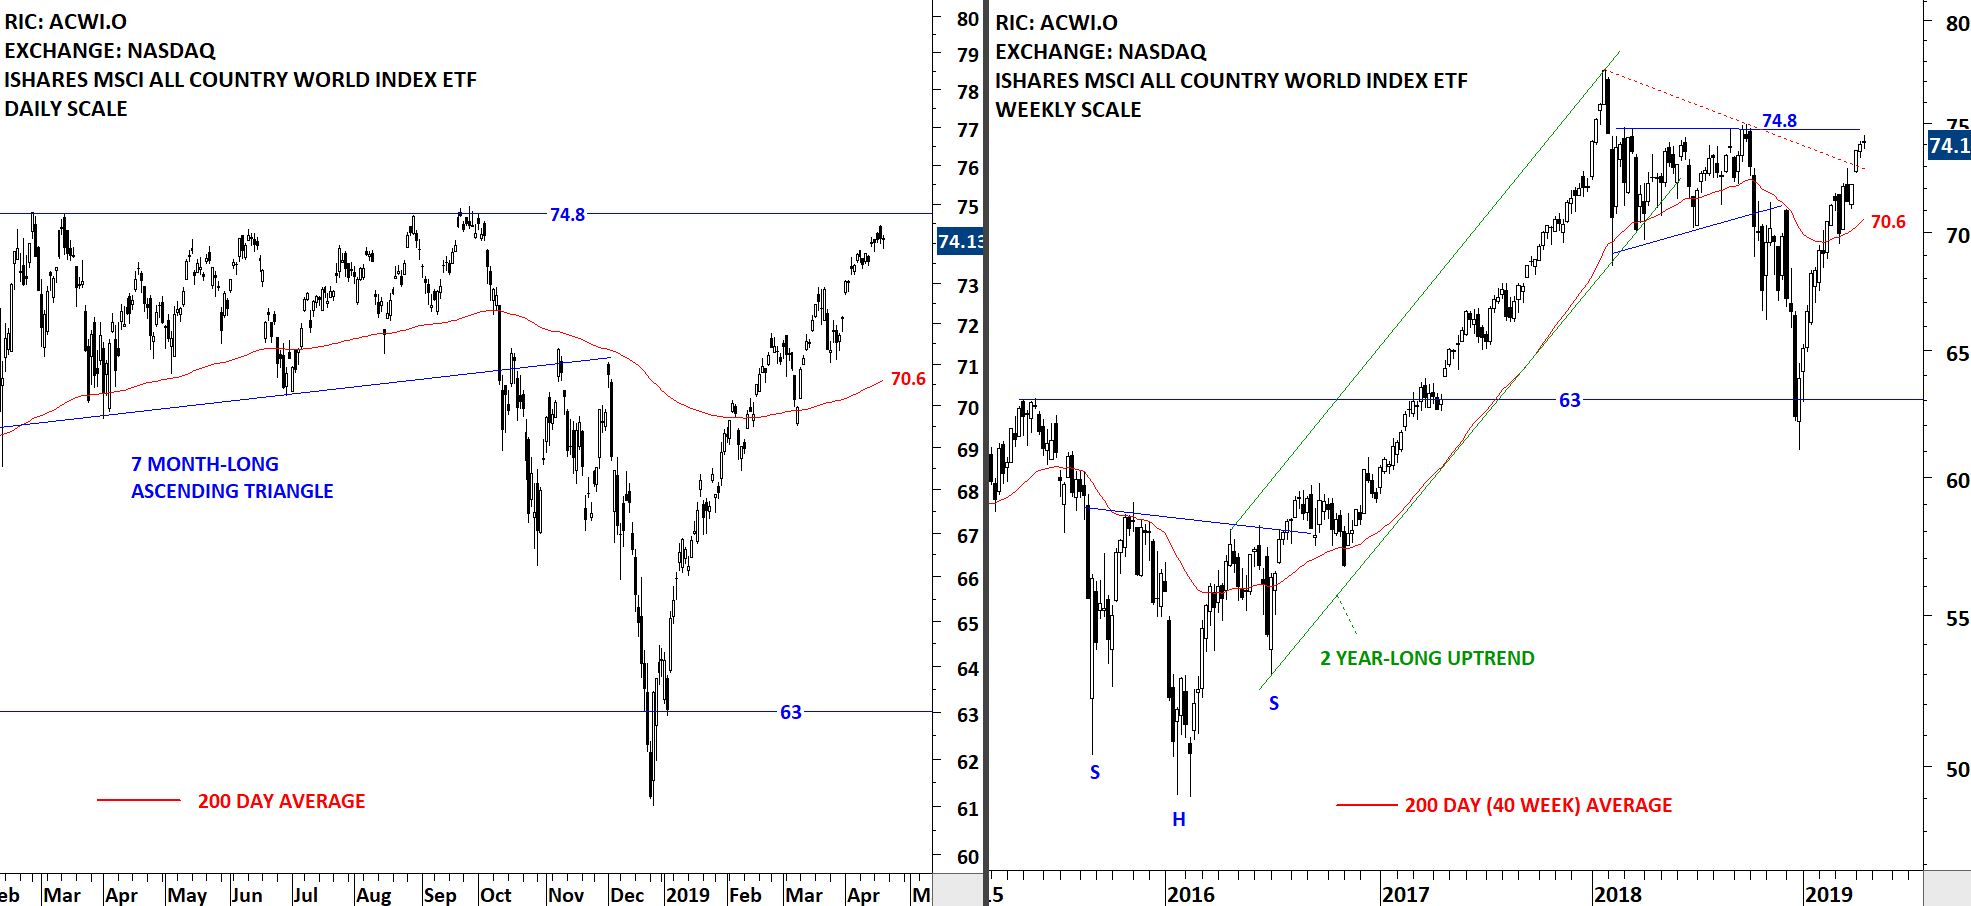
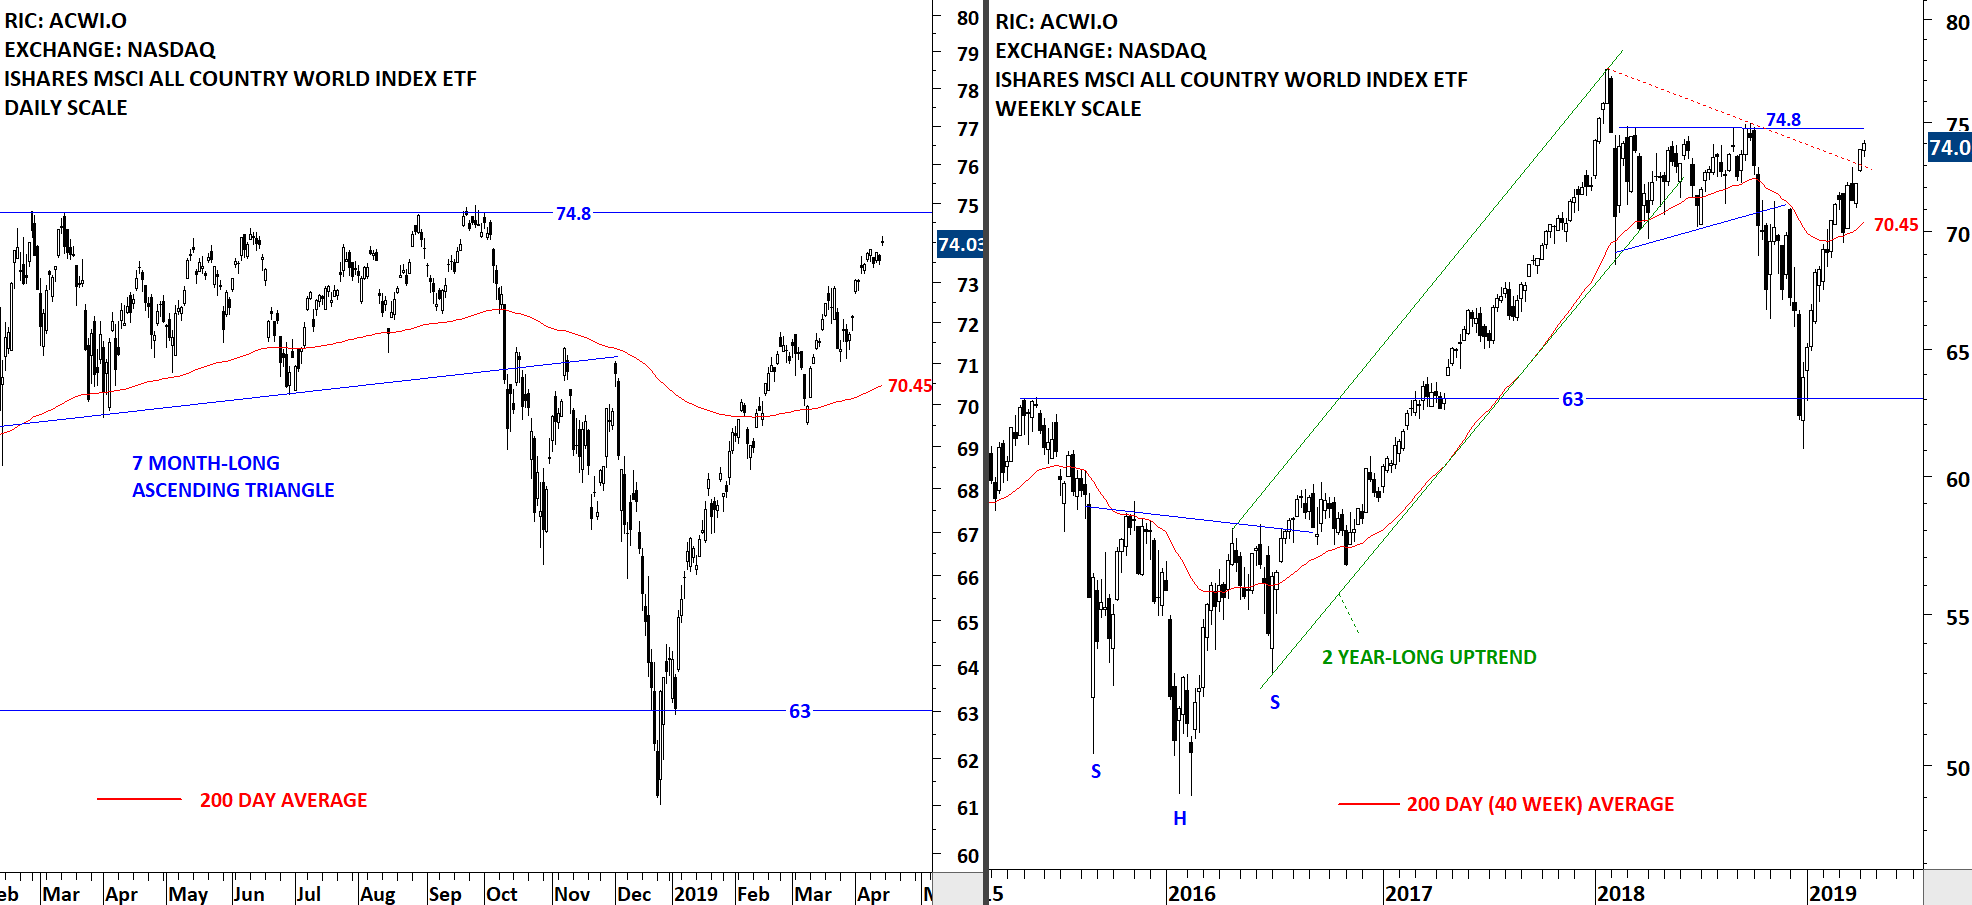
The benchmark for the Global equity markets performance, the iShares MSCI All Country World Index ETF (ACWI.O), is now very close to a horizontal resistance at 74.8 levels. Given the magnitude of the strong rebound and the steady rise without any pullback, one can't rule out the possibility of a breather/pause around the resistance at 74.8 levels. If we see a pullback, the 200-day moving average which is currently at 70.6 levels can act as support.
 Read More
GLOBAL EQUITY MARKETS – April 13, 2019
REVIEW
The benchmark for the Global equity markets performance, the iShares MSCI All Country World Index ETF (ACWI.O) is now close to a horizontal resistance at 74.8 levels. The ETF had a strong rebound from 63 levels. The V-bottom reversal was followed by the ETF clearing its long-term moving average in February. Since then the ACWI ETF has been trending above its long-term average. I consider price action above the long-term average as positive and classify it as an uptrend. Though it is important to note that, last few month's price action has been steep and such steep advances are not sustainable. During any setback the long-term moving average at 70.45 levels will act as support. Short-term resistance stands at 74.8 levels.
 Read More
Live Webinar and Q&A with Aksel – Thursday, April 18, 8:30am mountain
Dear Tech Charts Members,
We are continuing our Member webinar series with inverse H&S chart pattern that acts as a bottom reversal and also as a continuation. Over the past few weeks Global equity markets report identified some well-defined and mature H&S bottom reversals and H&S continuation chart patterns. I hope to highlight differences between these two types of bullish chart patterns and discuss how they develop in the general context of overall price action.
Scheduled for: Thursday, April 18 at 8:30am MST (register below)
The upcoming webinar is dedicated to a thorough discussion on inverse head and shoulder (reversal) and bullish H&S continuation.
- We will review some of those chart pattern breakouts that were featured in the Global Equity Markets report.
- We will review some of the qualities we look for when identifying and differentiating H&S bottom and H&S continuation
- We will look at some of the developing bullish continuation chart patterns
- We will continue to highlight Tech Charts members favorite chart pattern setups in different equity markets. As always please feel free to send charts for discussion.
- We will have a member Q&A at the end of the webinar.

