
GLOBAL EQUITY MARKETS – June 29, 2019
REVIEW
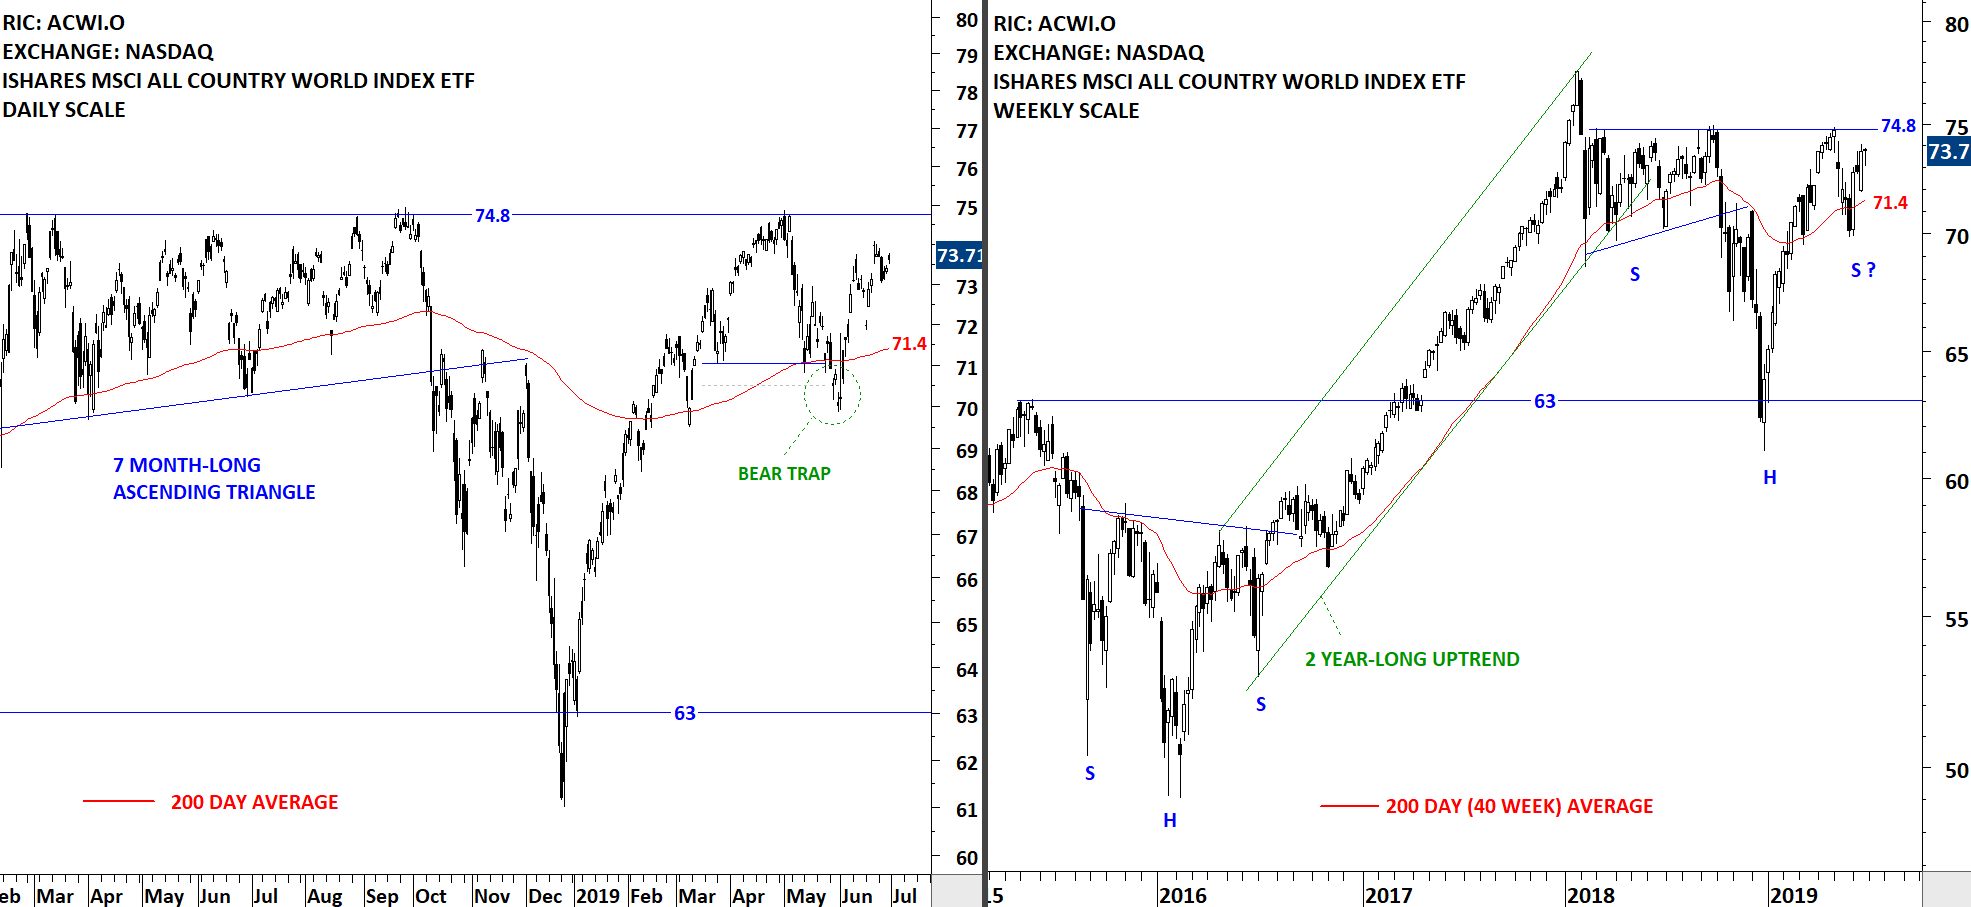
The benchmark for the Global equity markets performance, the iShares MSCI All Country World Index ETF continues to remain in a range between the horizontal resistance at 74.8 and the 200-day moving average at 71.4 levels. In the previous report I discussed the possibility of a H&S continuation chart pattern with the neckline standing at 74.8 levels. Price can continue to consolidate between the two important technical levels. A breakout above the horizontal resistance will be very positive for Global equities.
 Read More
GLOBAL EQUITY MARKETS – June 22, 2019
REVIEW
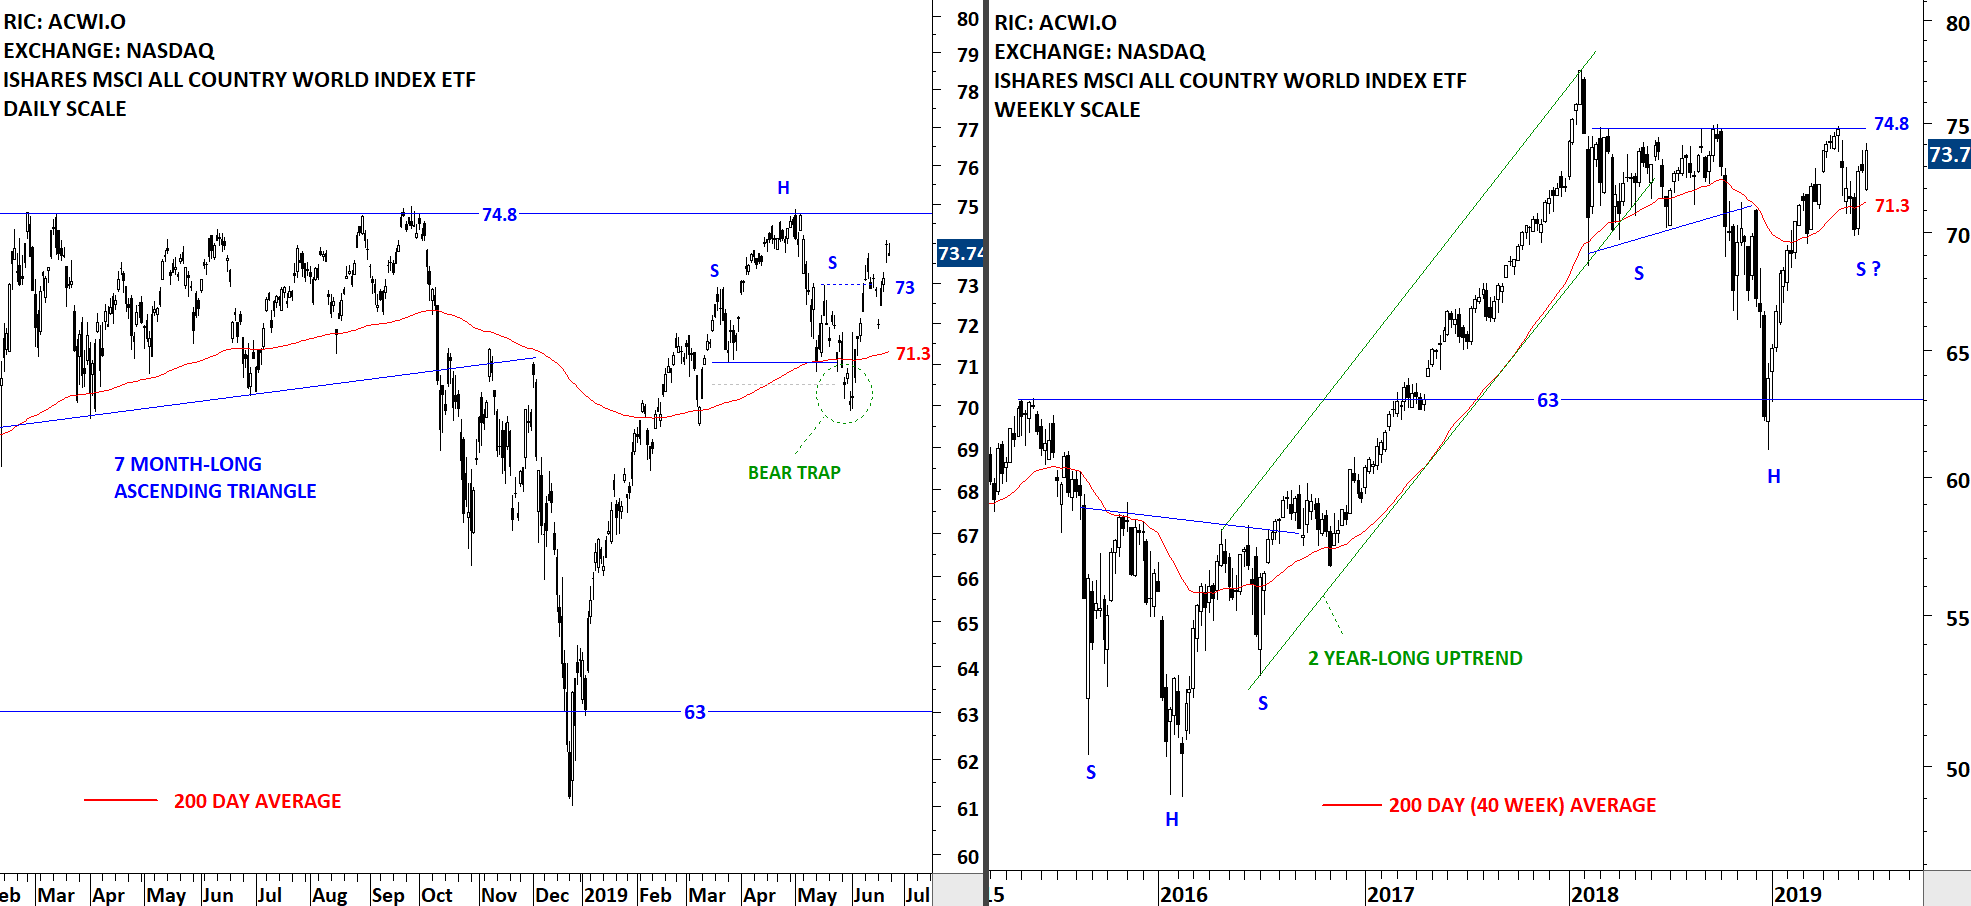
The benchmark for the Global equity markets performance, the iShares MSCI All Country World Index ETF (ACWI.O) remains above its 200-day average. Strong resistance stands at 74.8 levels and the 200-day moving average as support at 71.3 levels. The weekly scale price chart can form a possible H&S continuation. So far the right shoulder formed symmetry in price but not in time. In other words the time it took for the left shoulder has been longer than the right shoulder. Perfect symmetry is rare. Breakout above 74.8 levels will be positive for Global equities.
 Read More
GLOBAL EQUITY MARKETS – June 15, 2019
REVIEW
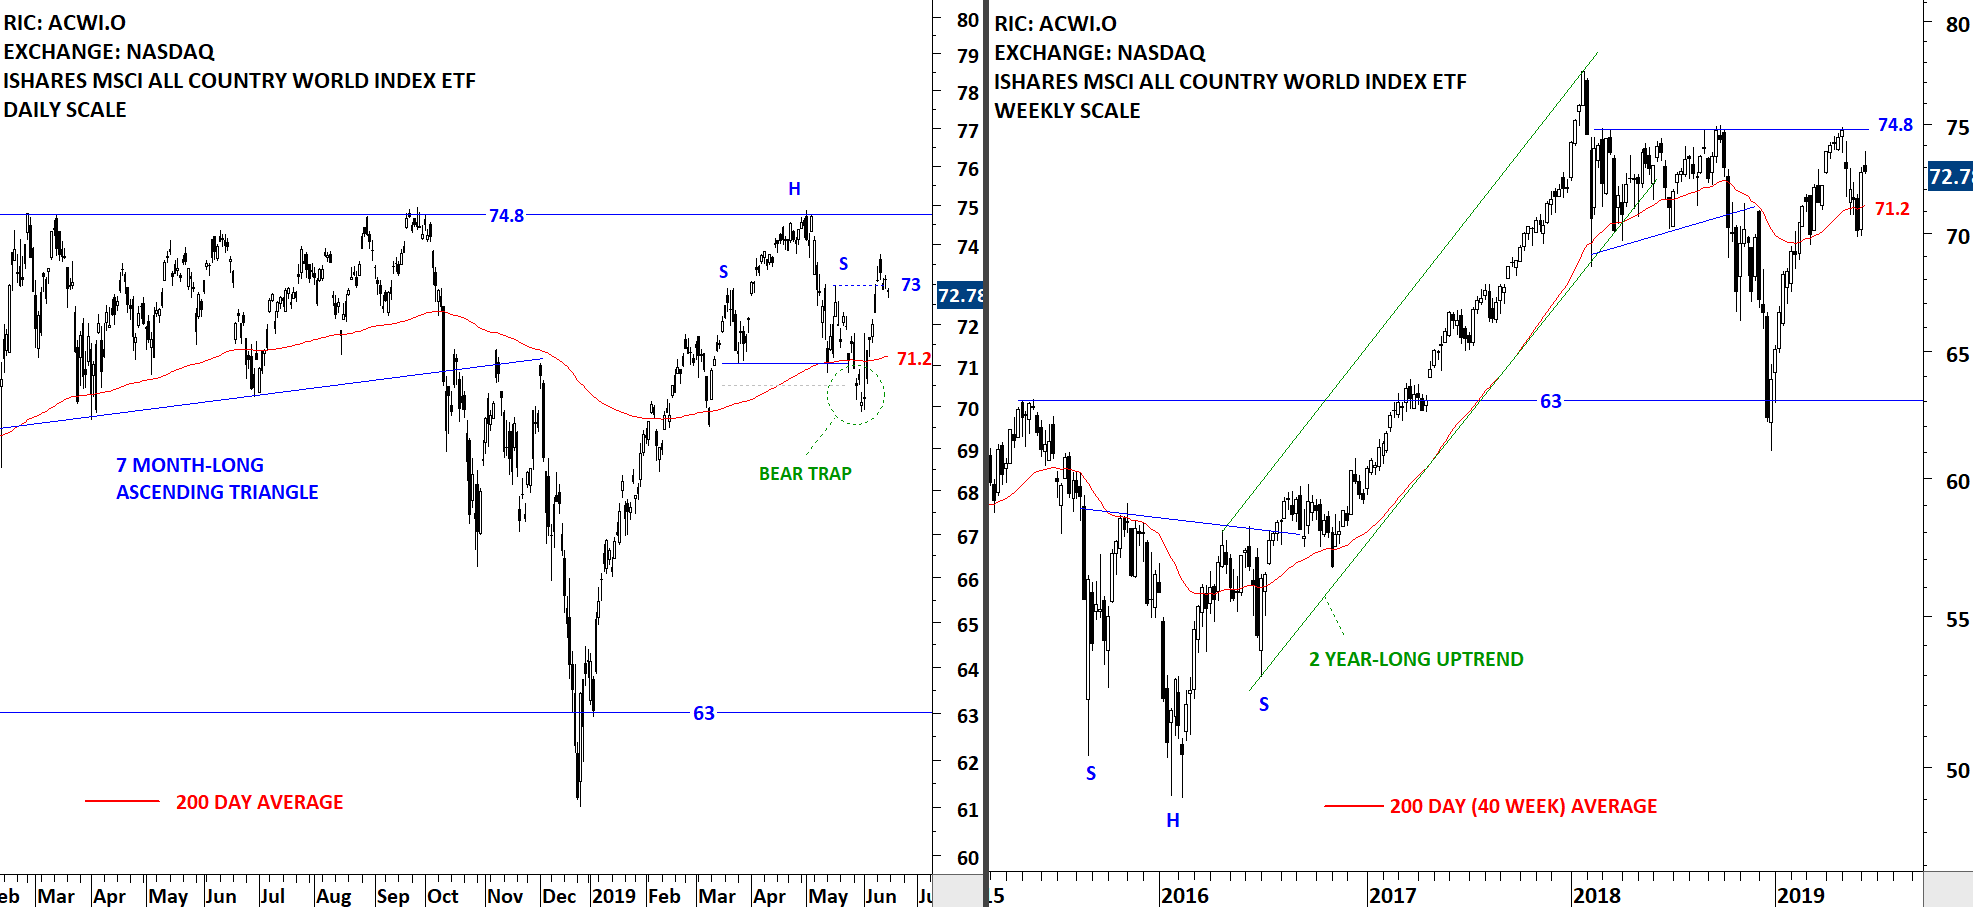
The benchmark for the Global equity markets performance, the iShares MSCI All Country World Index ETF (ACWI.O) held onto its past week's gains. The ETF didn't move much and remained in a range between the 200-day moving average at 71.2 and the horizontal resistance at 74.8 levels. There is no clear trend or a recognizable chart pattern in the short-term. The ETF offers short-term trading opportunity between the boundaries at 71.2 and 74.8.
 Read More
