
GLOBAL EQUITY MARKETS – August 31, 2019
REVIEW
The benchmark for the Global equity markets performance, the iShares MSCI All Country World Index ETF (ACWI.O) formed a short-term consolidation range between 70 and 72.5 levels. The larger scale consolidation is between 70 and 74.8 levels. The boundaries have become well-defined. Breakout above the minor resistance at 72.5 levels can send the ETF towards the resistance at 74.8 levels. Failure at the minor resistance can result in further sideways consolidation between 72.5 and 70 levels. How the ETF resolves from the recent tight consolidation will decide on the last quarter performance for Global equities.
Read More
INTERIM UPDATE – August 30, 2019
- A detailed analysis of chart pattern reliability/statistics of all breakout alerts (will be available soon).
- A new schedule to focus on identifying and featuring more shorter-term breakout opportunities for our members with short-term focus. The weekly Global equity markets report features chart patterns in duration between 4 months - 24 months. I will start adding 2 months - 4 months duration chart patterns on daily scale price charts. A recent example is in this Interim Update (MERCK KGA).
- Quarterly member webinar due in September. (date and time will be announced soon).
As I put together the weekly Global equity markets report, I though of sending this Interim Update given the fast moving nature of the past few days equity markets. Members might want to take advantage of those breakouts, if they take place in the last trading day of the week. This update is prepared during Europe trading hours. Charts are as of 11:00 am CET.
Read More
GLOBAL EQUITY MARKETS – August 24, 2019
REVIEW
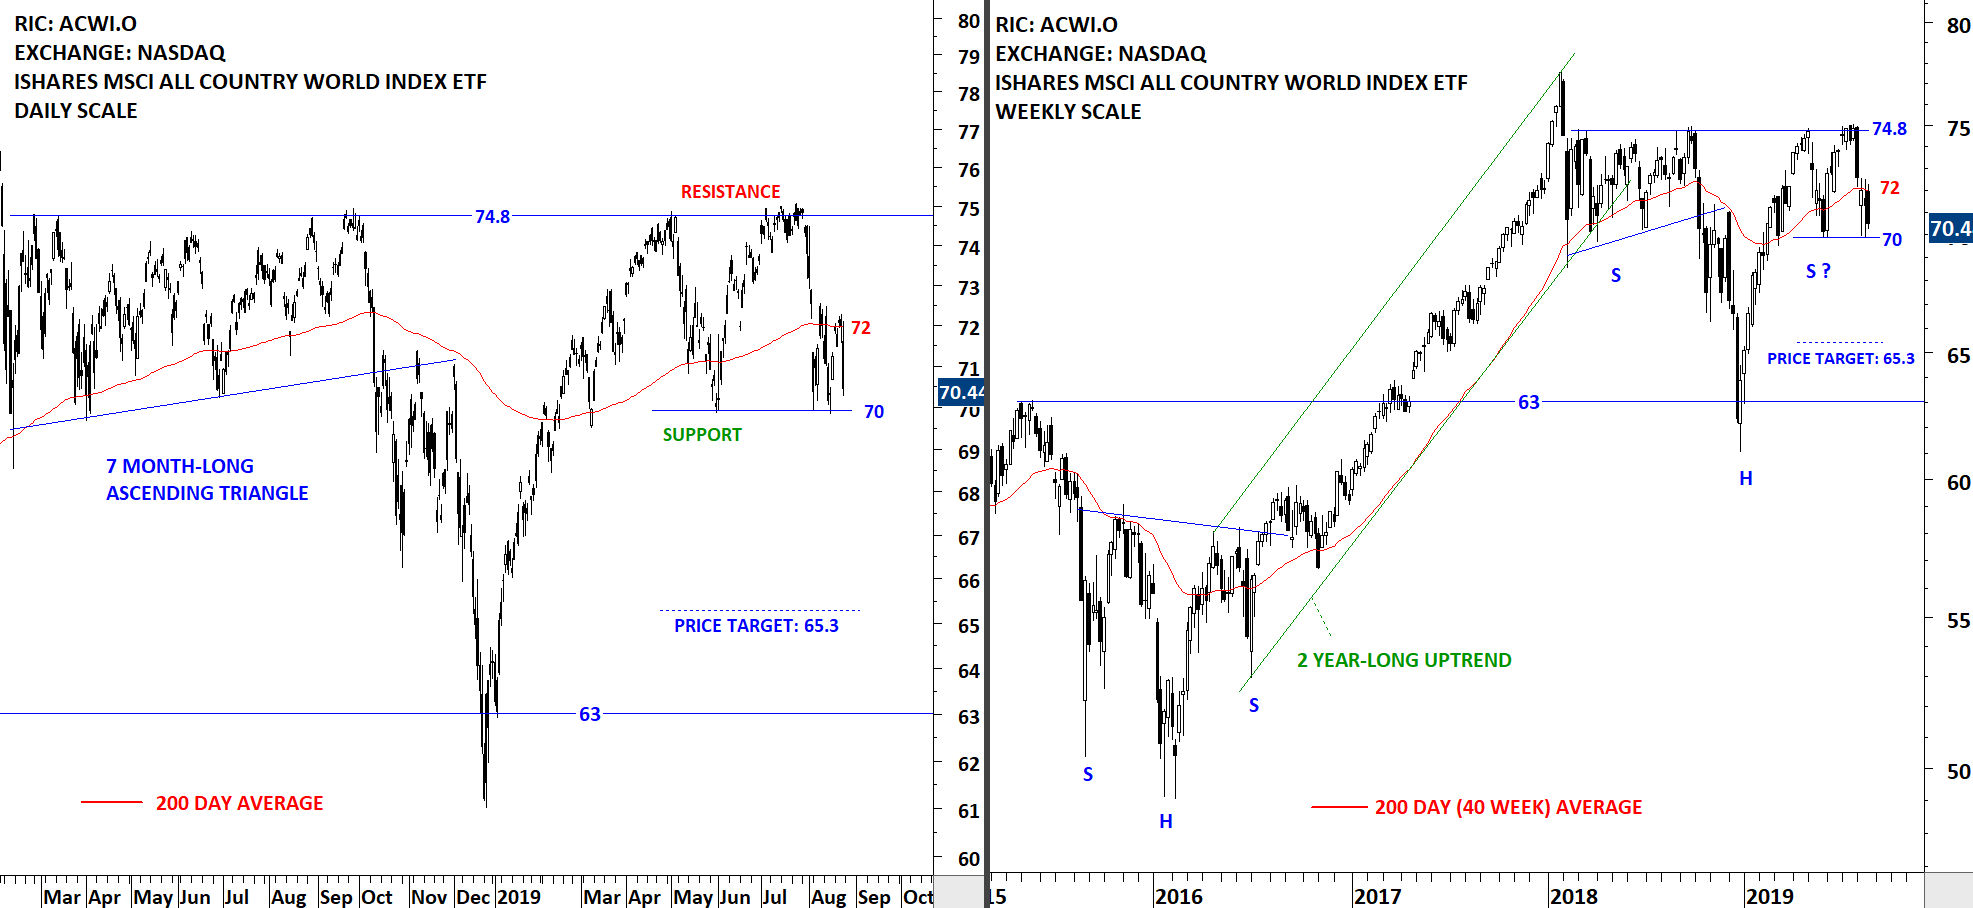
The benchmark for the Global equity markets performance, the iShares MSCI All Country World Index ETF (ACWI.O) failed to push above its 200-day moving average at 72 levels. Friday's sell-off pulled the index towards the support level at 70 levels. Breakdown below 70, after several tests, can complete a possible double top with the price target of 65.3 levels. Though, the ETF might try to stabilize at 70 levels once again. I monitor this chart for a possible breakdown.
 Read More
