
GLOBAL EQUITY MARKETS – December 14, 2019
REVIEW
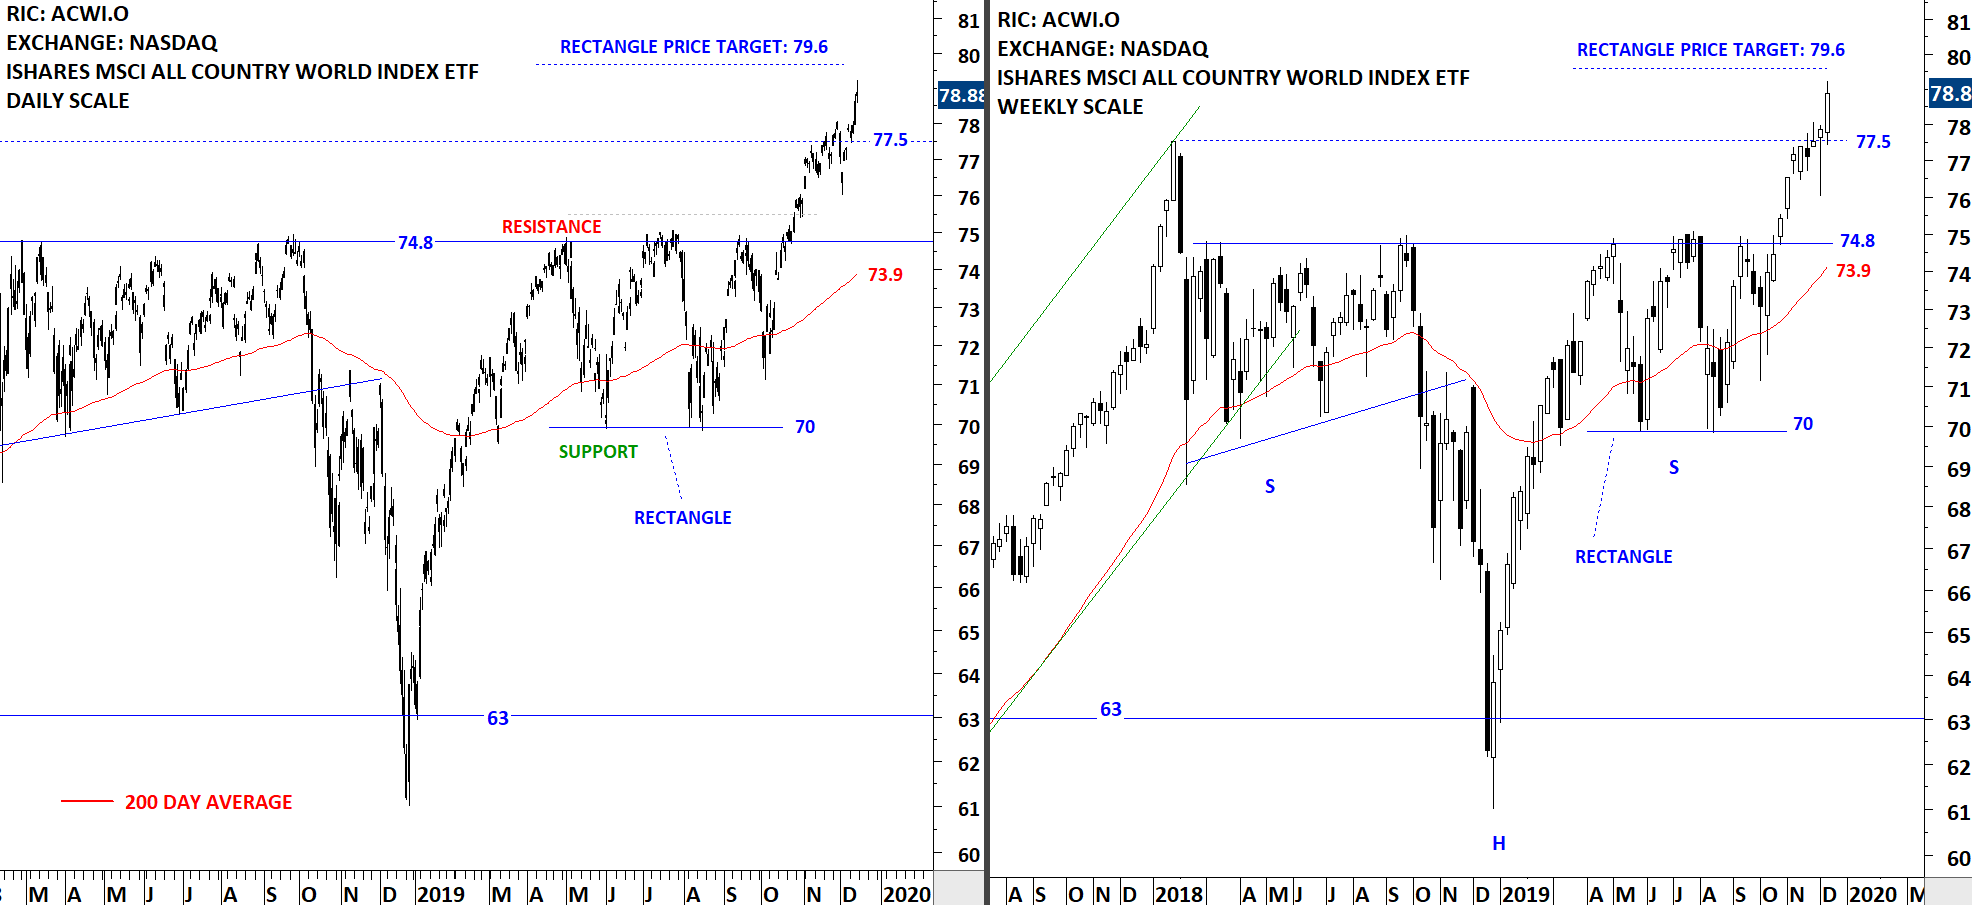
The benchmark for the Global equity markets performance, the iShares MSCI All Country World Index ETF (ACWI.O) cleared the resistance at 77.5 levels. After a week of short-term volatility and pullback the ETF resumed higher towards its possible rectangle chart pattern price target at 79.6 levels. Both the daily and weekly price charts show a steady uptrend.
 Read More
Live Webinar and Q&A with Aksel – Thursday, December 12, 8:30 am mountain
Global Equity Markets report started focusing on shorter-term time frame chart pattern developments as well as long-term patterns. Short-term chart patterns are those that cover anything from 1 month to 3 months (according to Tech Charts Research), whereas longer-term patterns are from 4 months to 24 months. Short-term chart patterns are featured on daily scale price charts, and it is important to see and understand the price dynamics of those in comparison with weekly scale breakouts. We will dedicate this webinar to several short-term examples on different chart patterns such as cup & handle, ascending triangle, descending triangle, rectangle, H&S bottom, and compare those with similar developments on weekly scale price charts. I hope to touch on risk-reward, price target calculations, and breakout confirmation levels on all those chart pattern breakout examples.
Scheduled for: Thursday, December 12, 8:30 am mountain (register below)
Read More
GLOBAL EQUITY MARKETS – December 7, 2019
REVIEW
The benchmark for the Global equity markets performance, the iShares MSCI All Country World Index ETF (ACWI.O) found resistance at 77.5 levels. Last week's bearish shooting star candlestick pattern proved to be a short-term correction signal. Following a quick sell-off (intra-week) the ETF recovered to test its previous high.
Is the short-term correction over? Read More

