
GLOBAL EQUITY MARKETS – December 21, 2019
REVIEW
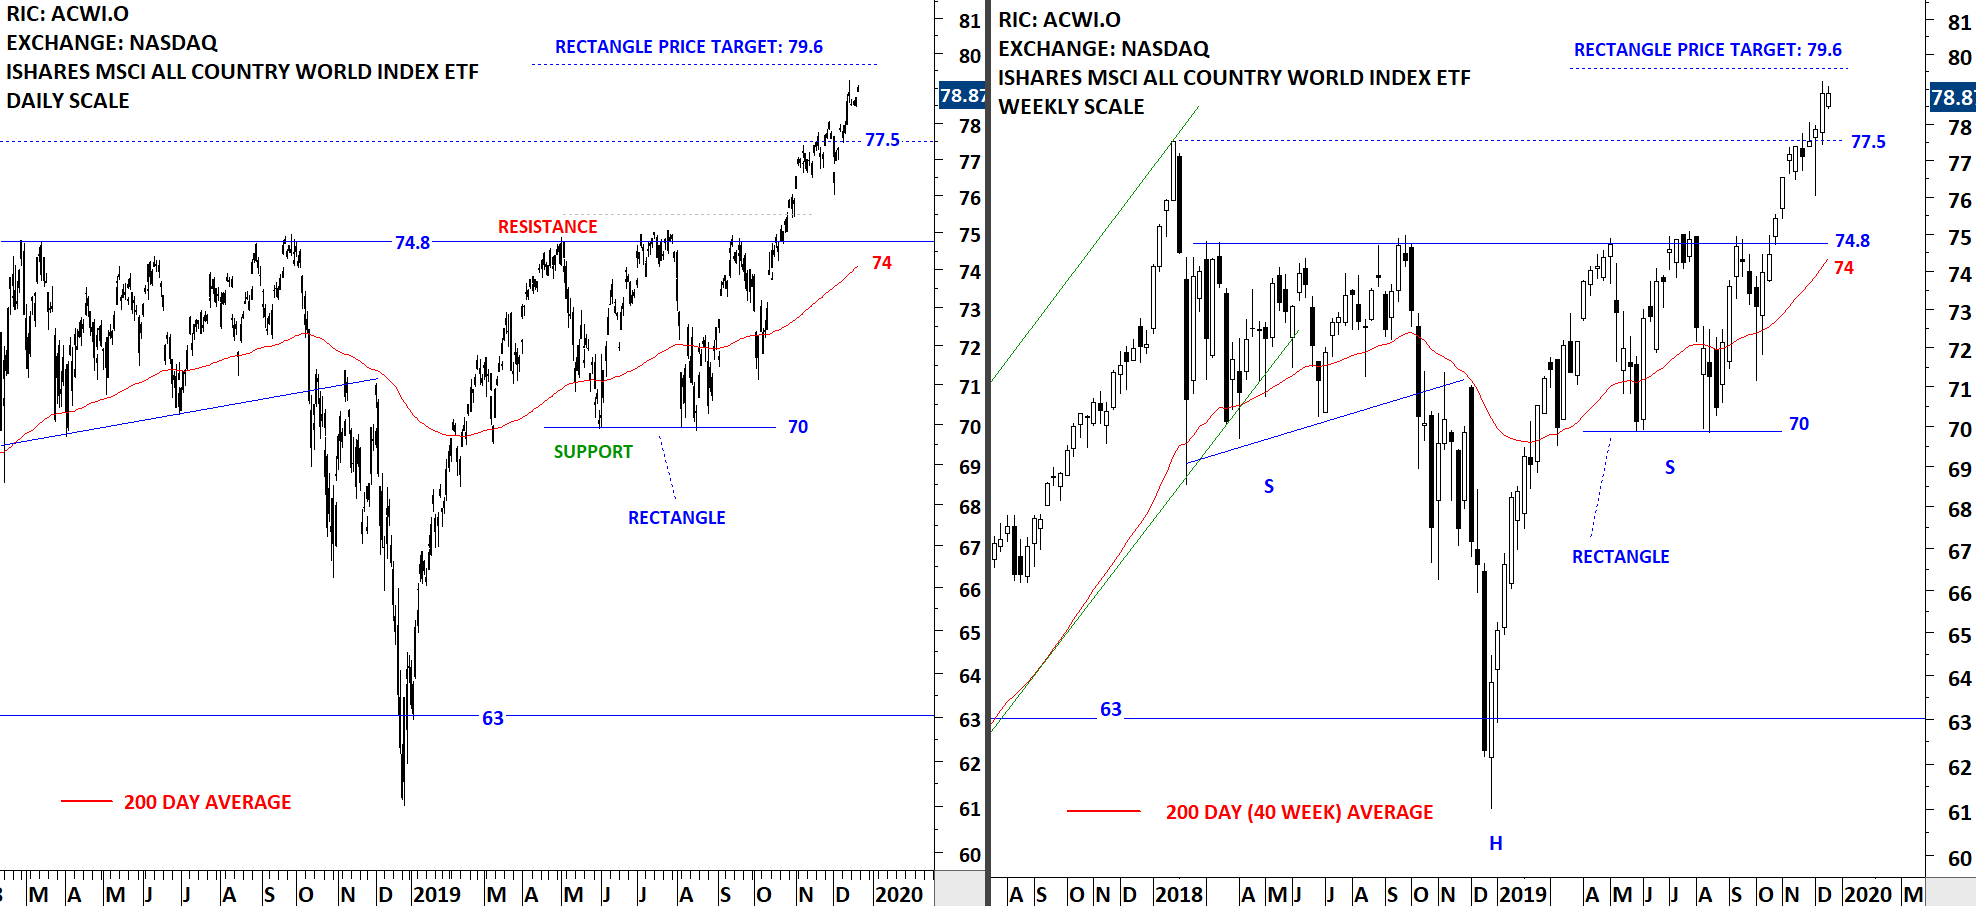
The benchmark for the Global equity markets performance, the iShares MSCI All Country World Index ETF (ACWI.O) continues to resume its uptrend after completing both the rectangle and H&S continuation chart patterns. Daily and weekly price charts show a steady uptrend. Rectangle price target stands at 79.6 levels.
 Read More
INTERIM UPDATE – December 20, 2019
Dear Tech Charts members,
As mentioned in our previous communications I've been working on bringing more short-term chart pattern setups into your attention from the Global equity markets. In doing so I'm paying close attention to have liquid names. Tech Charts Global Equity markets report featured mostly chart pattern in duration between 4 months - 24 months. We are now focusing as well on chart patterns in duration between 2 months - 4 months featured on daily scale. I will continue to bring those opportunities either via Interim Updates or the weekly Global Equity Markets report. Below are 4 additions to Tech Charts watchlist that may experience breakouts in the last trading day of the week. These charts will also be included in the weekly update.
Read More
Short-Term Chart Patterns – December 2019 Tech Charts Webinar
- We will review some of those chart pattern breakouts that were featured in the Global Equity Markets report
- We will review some of the conditions that are required for successful completion of different chart patterns both on daily and weekly time frame
- We will look at some of the developing chart patterns
- We will have a member Q&A at the end of the webinar
- Do you use MA or EMA? 50:33
- I wanted to check if it is possible for you to include in your weekly report a performance of setup of your charts? 51:02 (Webinar mentioned A review of the most reliable chart patterns Tech Charts Global Equity Markets report featured over the past two years – September 2019 Tech Charts Webinar)
- Can the ascending or descending triangle be trend reversal patterns? 51:37
- Can you discuss success rates for weekly setups vs. daily? 52:37
- If the handle is a bit above the cup is the breakout level above the cup or above the handle? 53:48
- When you post a breakout alert on the website, is the red number dotted line a negation level or your initial stop loss? 54:17
- What's the ATR setting you use and do you check and adjust stops on a daily basis? 54:45 (Helpful link ATR Trailing Stop-Loss – H&S Top)

