
GLOBAL EQUITY MARKETS – January 18, 2020
REVIEW
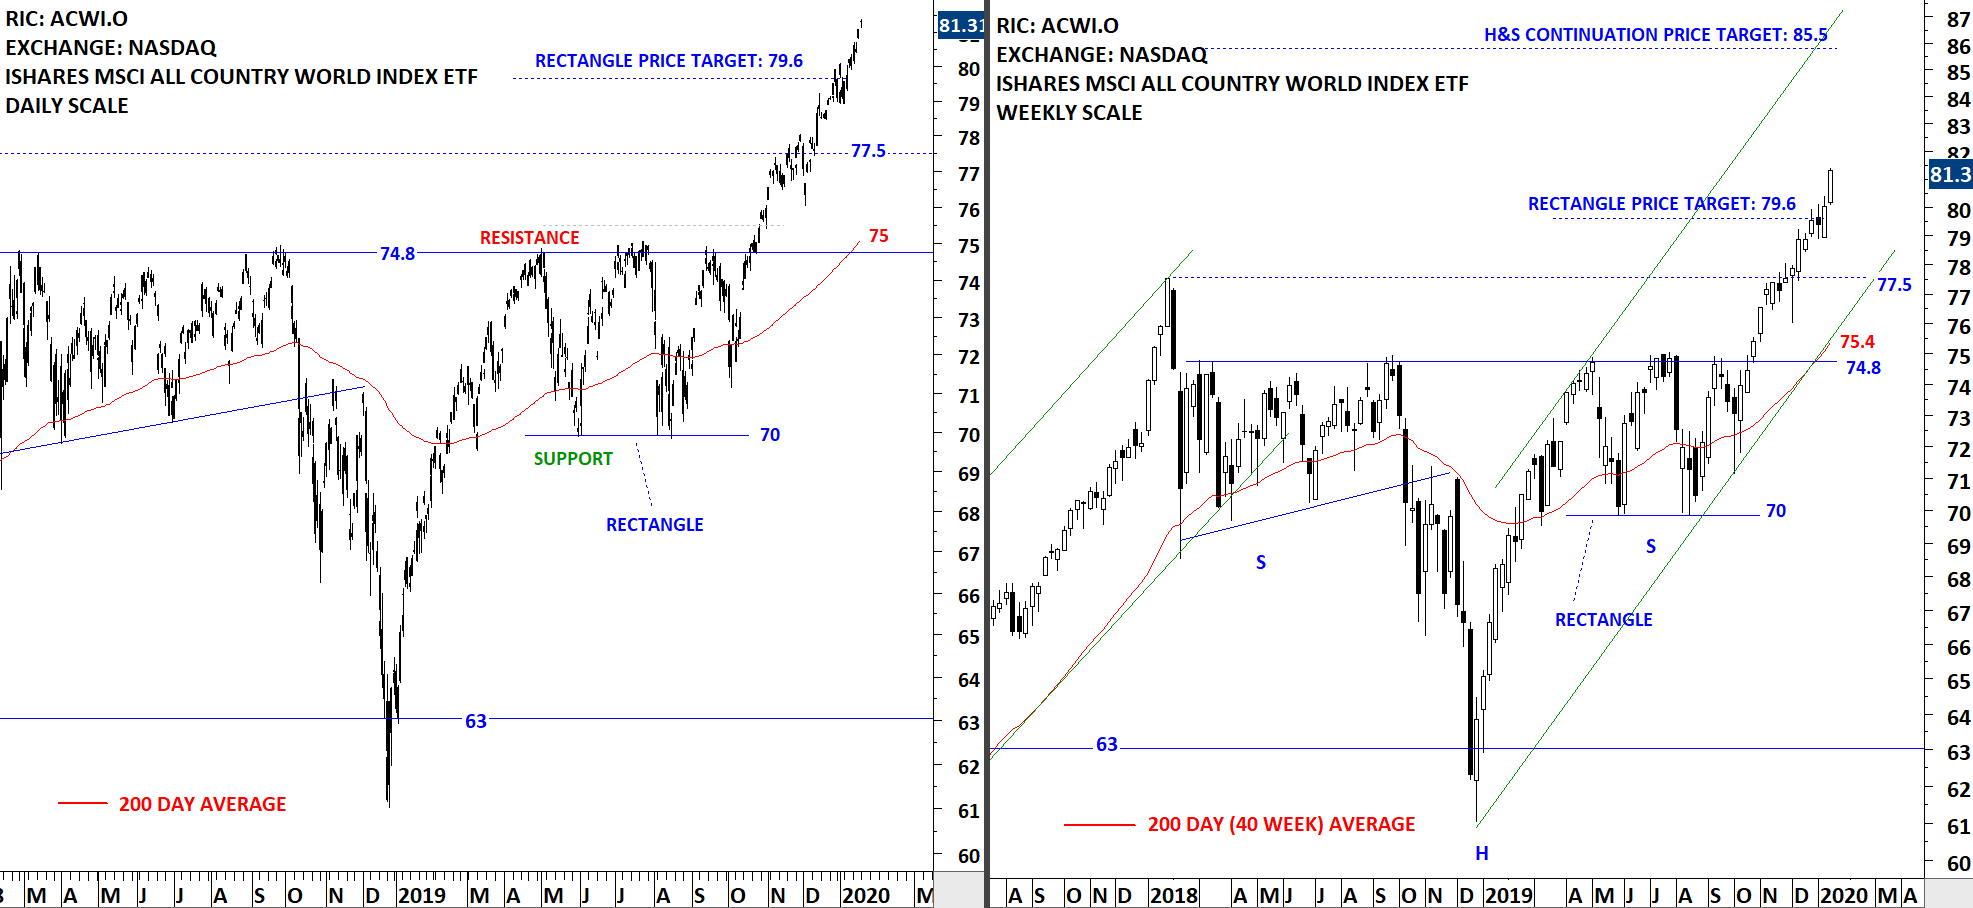
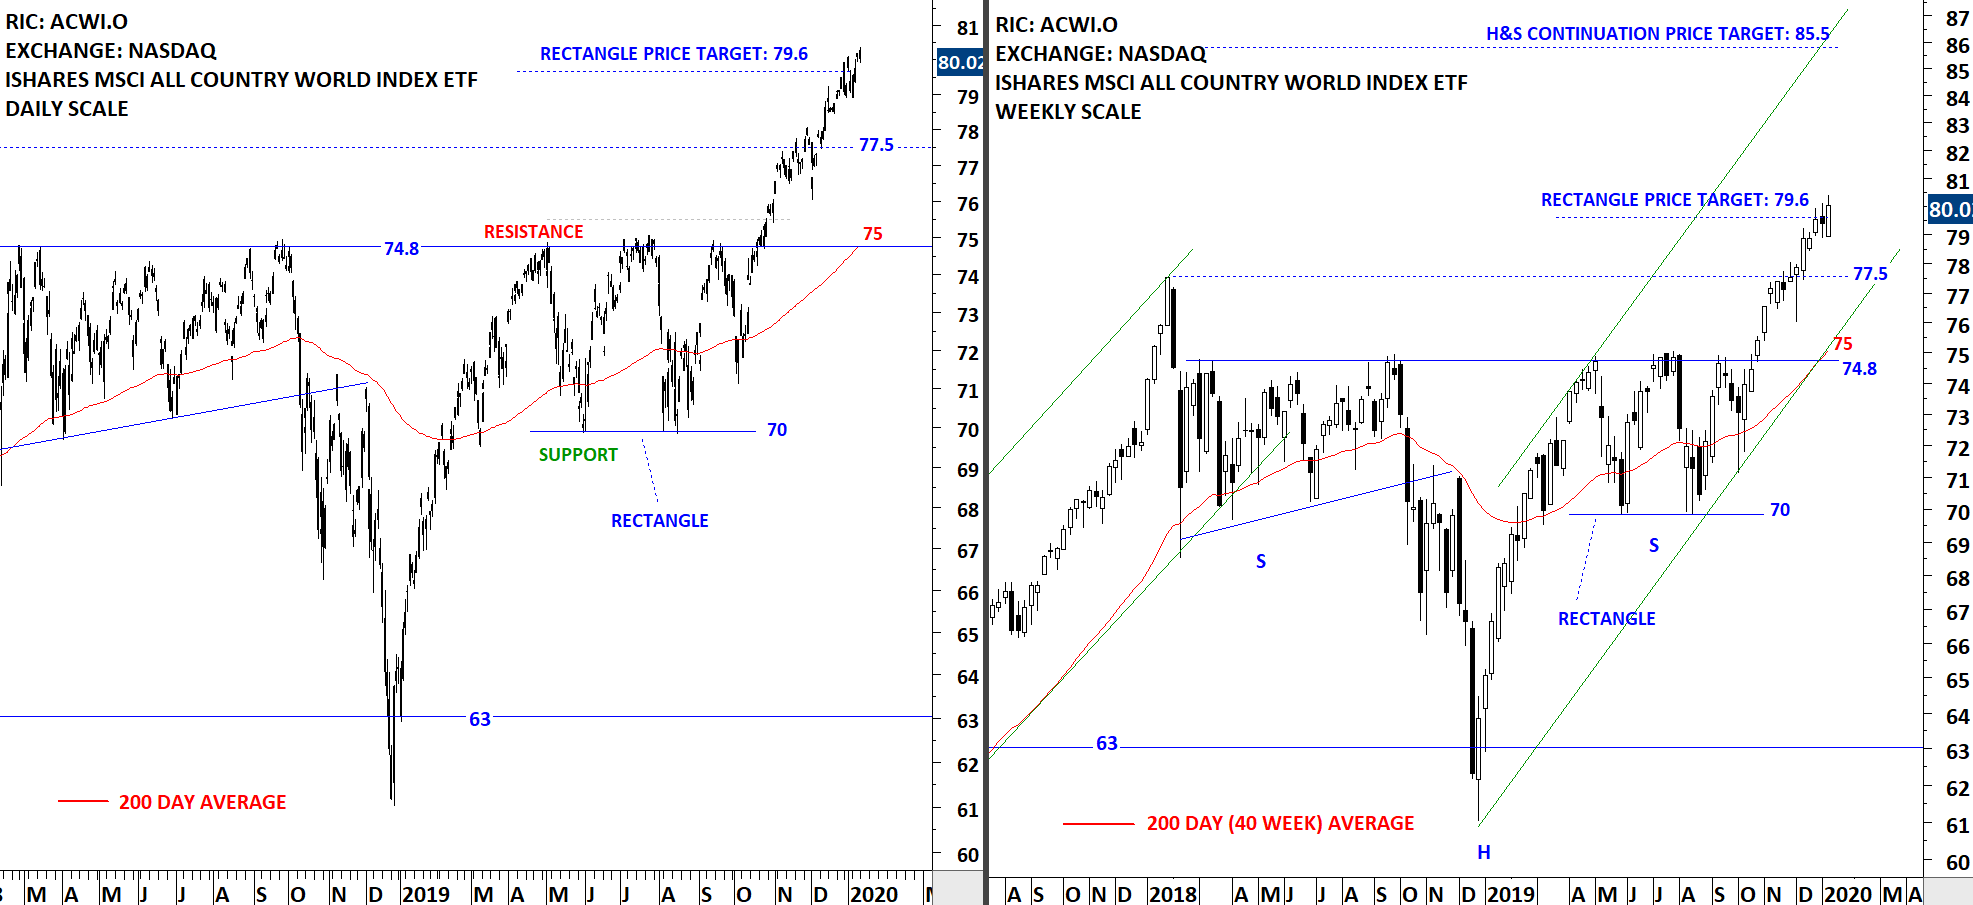
The benchmark for the Global equity markets performance, the iShares MSCI All Country World Index ETF (ACWI.O) continues to remain strong after completing both rectangle and H&S continuation chart patterns. ACWI ETF is in a steady uptrend. During any pullback, the high of 2018 (77.5) can act as support. It is usually difficult to pick tops and bottoms. The best way to approach strong trending markets is to trail it with trend following indicators such as ATR based trailing stops or different period moving averages. Selection of moving average period will depend on your time frame. Short-term moving averages will trail the price closely, resulting in an early exit signal.
 Read More
INTERIM UPDATE – January 16, 2020
I start my research on Mondays and finalize by end of day Thursday. Friday is dedicated to putting all ideas to the report format. During the week I come across good setups and those are featured in the weekly report. However, there are those that pop during the week and is worth bringing to your attention before the week finalizes. Below are 2 additions to Tech Charts watchlist that may experience breakouts. These charts will also be included in the weekly update.
Read More
GLOBAL EQUITY MARKETS – January 11, 2020
REVIEW
The benchmark for the Global equity markets performance, the iShares MSCI All Country World Index ETF (ACWI.O) continues to remain strong after completing both rectangle and H&S continuation chart patterns. The right shoulder of a possible H&S continuation was identified as a rectangle with the price target of 79.6 levels. So far the price remained stable after reaching price objective. ACWI ETF is in a steady uptrend. During any pullback, the high of 2018 (77.5) can act as support.
 Read More
