
GLOBAL EQUITY MARKETS – February 8, 2020
REVIEW
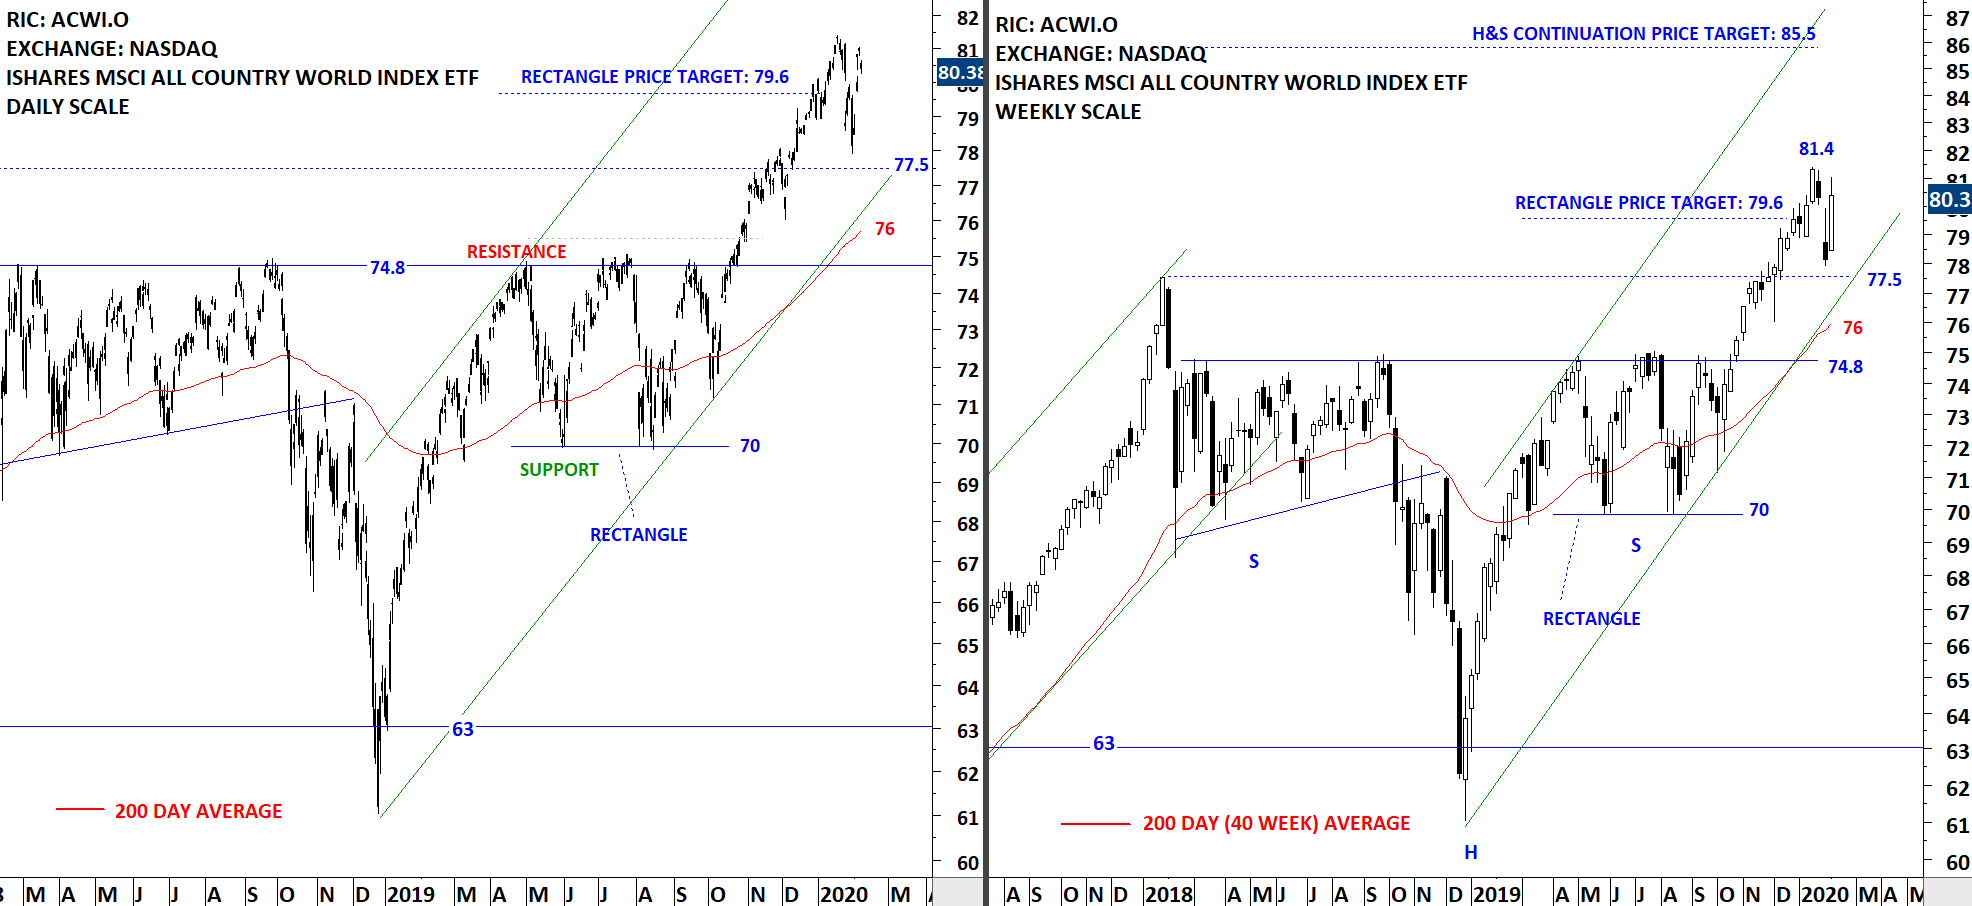
The benchmark for the Global equity markets performance, the iShares MSCI All Country World Index ETF (ACWI.O) rebounded from support at 77.5 levels. On the price chart last one month's price action seems like a pullback to the high seen in 2018 (77.5). ACWI ETF is still in a steady uptrend. While this week's price was a strong rebound, unless the high at 81.4 is broken on the upside we can see further sideways consolidation between 77.5 and 81.4. The 200-day moving average is still far from the price at 76 levels.
 Read More
GLOBAL EQUITY MARKETS – February 1, 2020
REVIEW
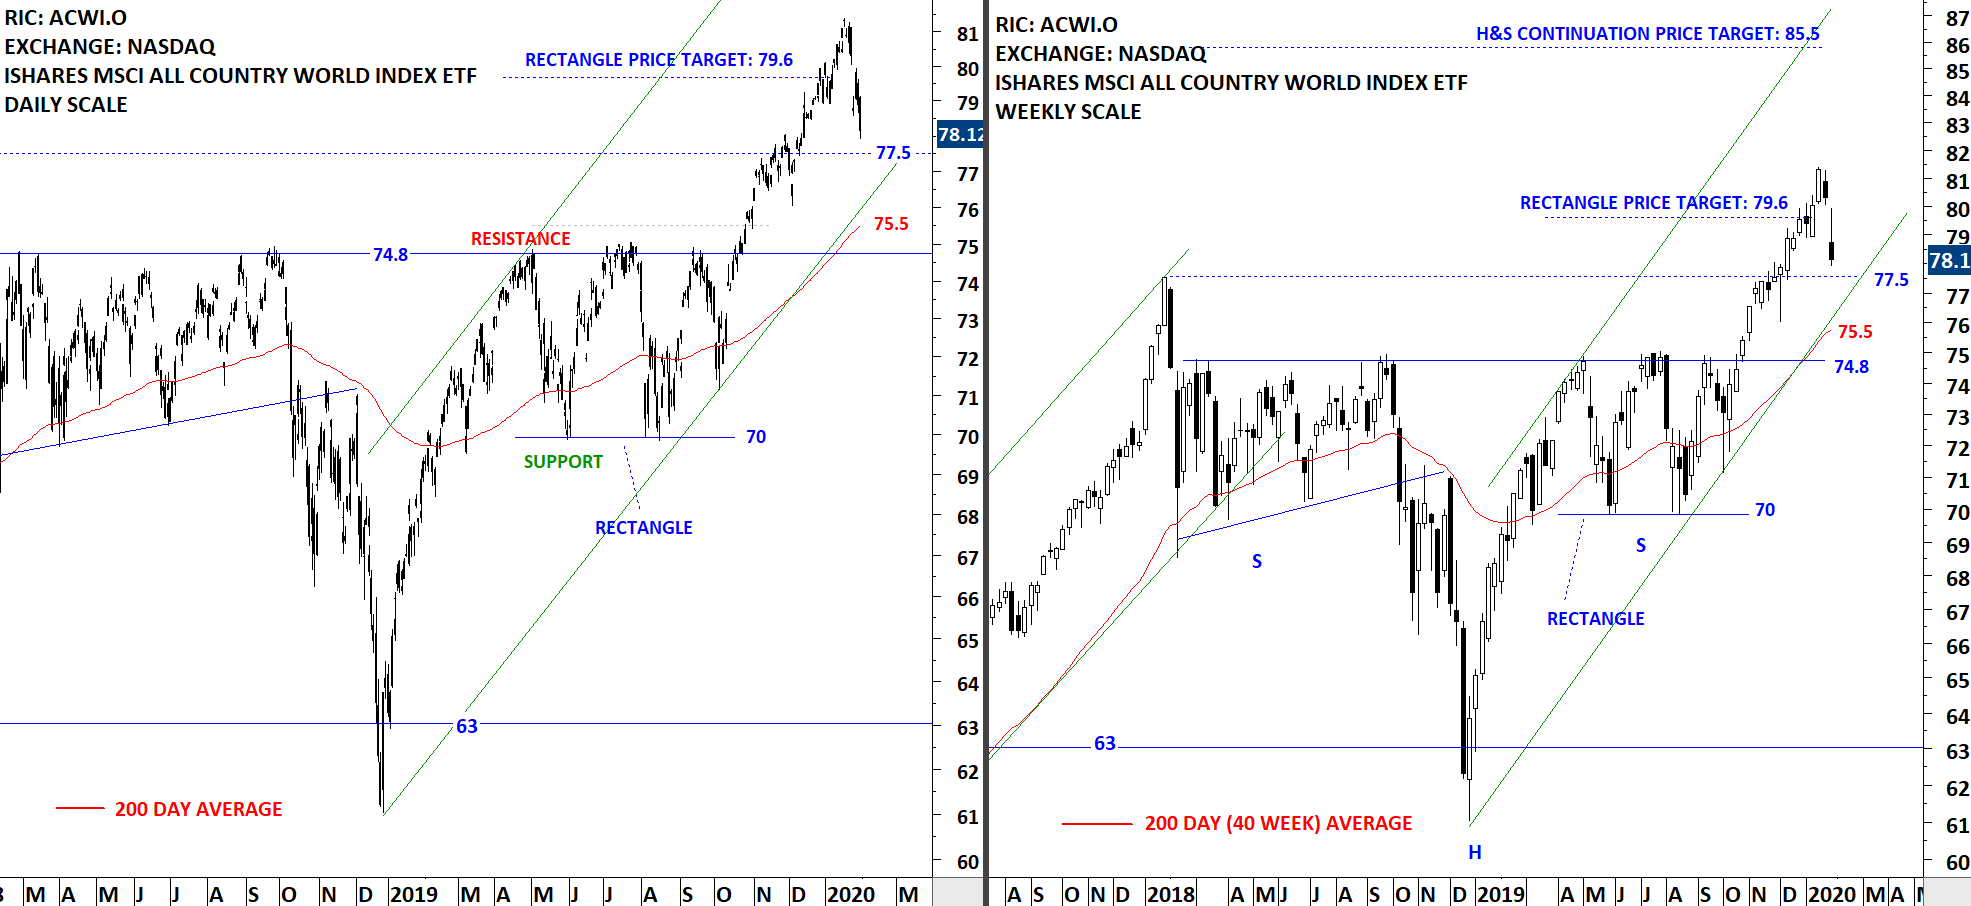
The benchmark for the Global equity markets performance, the iShares MSCI All Country World Index ETF (ACWI.O) resumed lower towards strong support area between 75.5 and 77.5. The weekly chart opened with a gap. The gap was filled during the week. The week closed very close to its lowest level. ACWI ETF is still in a steady uptrend. During the recent pullback, the high of 2018 (77.5) can act as support. The 200-day moving average is still far from the price at 75.5 levels.
 Read More
GLOBAL EQUITY MARKETS – January 25, 2020
REVIEW
The benchmark for the Global equity markets performance, the iShares MSCI All Country World Index ETF (ACWI.O) experienced the first setback. The weekly price chart formed an inside week. ACWI ETF is in a steady uptrend. During any pullback, the high of 2018 (77.5) can act as support. The 200-day moving average is still far from the price at 75.4 levels.
 Read More
