
INTERIM UPDATE – February 19, 2020
I start my research on Mondays and finalize by end of day Thursday. Friday is dedicated to putting all ideas to the report format. During the week I come across good setups and those are featured in the weekly report. However, there are those that pop during the week and is worth bringing to your attention before the week finalizes. Below are 5 additions to Tech Charts watchlist that may experience breakouts. These charts will also be included in the weekly update.
Read More
GLOBAL EQUITY MARKETS – February 15, 2020
REVIEW
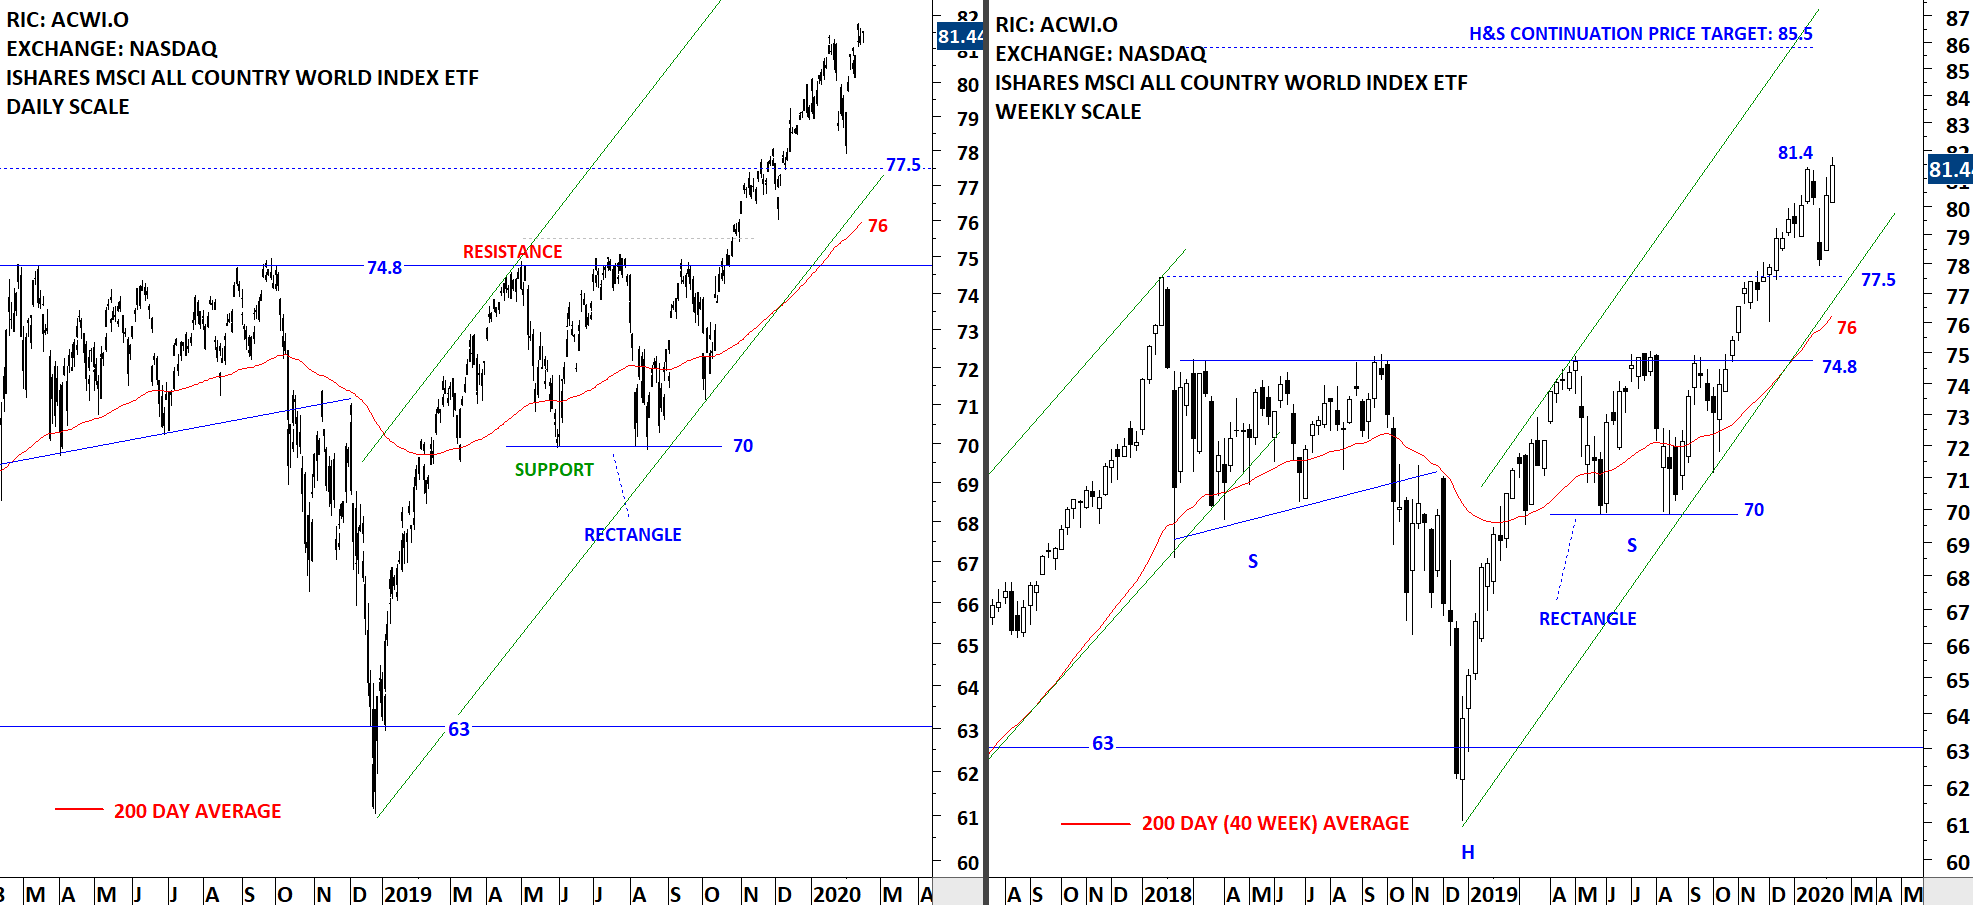
The benchmark for the Global equity markets performance, the iShares MSCI All Country World Index ETF (ACWI.O) tested the minor high at 81.4 levels. On the price chart last one month's price action seems like a pullback to the high seen in 2018 (77.5) and a continuation higher. ACWI ETF is still in a steady uptrend. The high at 81.4 is not yet broken on the upside and we can still see further sideways consolidation between 77.5 and 81.4. The 200-day moving average is still far from the price at 76 levels. Without much interpretation, we can conclude that the chart of of ACWI ETF is showing a clear uptrend.
 Read More
INTERIM UPDATE – February 13, 2020
I start my research on Mondays and finalize by end of day Thursday. Friday is dedicated to putting all ideas to the report format. During the week I come across good setups and those are featured in the weekly report. However, there are those that pop during the week and is worth bringing to your attention before the week finalizes. Below are 3 additions to Tech Charts watchlist that may experience breakouts. These charts will also be included in the weekly update.
Read More
